15 Marilyn Rd Bourne, MA 2532
Monument Beach NeighborhoodEstimated Value: $554,000 - $595,000
3
Beds
2
Baths
1,682
Sq Ft
$339/Sq Ft
Est. Value
About This Home
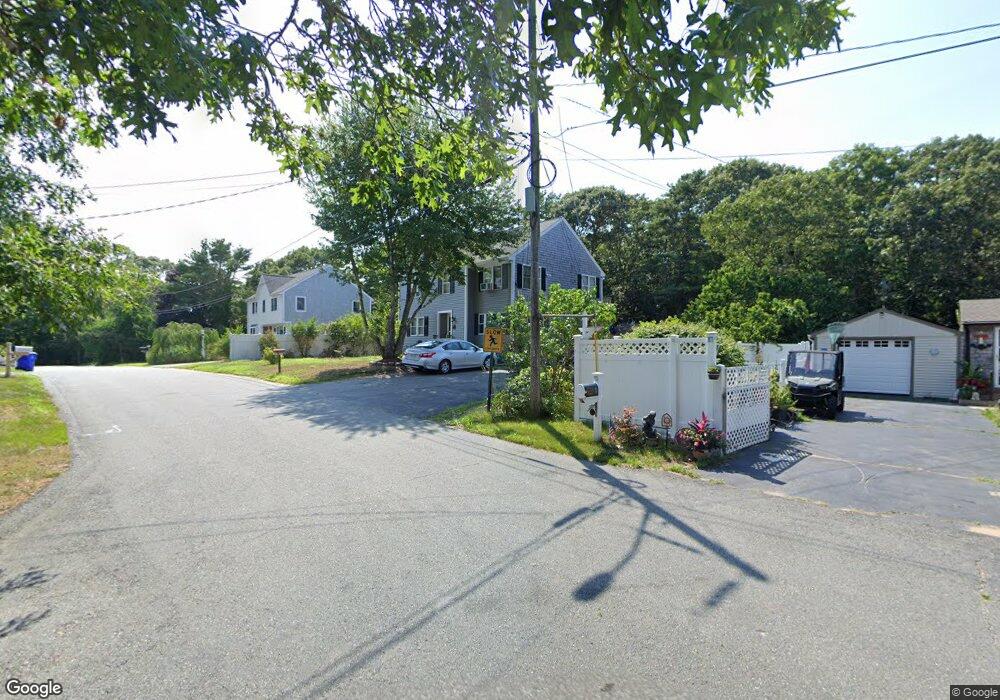
This home is located at 15 Marilyn Rd, Bourne, MA 2532 and is currently estimated at $570,396, approximately $339 per square foot. 15 Marilyn Rd is a home located in Barnstable County with nearby schools including Bourne High School, St Margaret Regional School, and Cadence Academy Preschool - Bourne.
Ownership History
Date
Name
Owned For
Owner Type
Purchase Details
Closed on
Dec 31, 1997
Sold by
Harthan Martha W
Bought by
Campbell Errol A and Campbell Debra E
Current Estimated Value
Create a Home Valuation Report for This Property
The Home Valuation Report is an in-depth analysis detailing your home's value as well as a comparison with similar homes in the area
Home Values in the Area
Average Home Value in this Area
Purchase History
| Date | Buyer | Sale Price | Title Company |
|---|---|---|---|
| Campbell Errol A | $73,000 | -- | |
| Campbell Errol A | $73,000 | -- |
Source: Public Records
Mortgage History
| Date | Status | Borrower | Loan Amount |
|---|---|---|---|
| Open | Campbell Errol A | $212,000 | |
| Closed | Campbell Errol A | $40,000 | |
| Closed | Campbell Errol A | $164,500 |
Source: Public Records
Tax History Compared to Growth
Tax History
| Year | Tax Paid | Tax Assessment Tax Assessment Total Assessment is a certain percentage of the fair market value that is determined by local assessors to be the total taxable value of land and additions on the property. | Land | Improvement |
|---|---|---|---|---|
| 2025 | $4,024 | $515,300 | $189,200 | $326,100 |
| 2024 | $3,927 | $489,600 | $180,200 | $309,400 |
| 2023 | $3,844 | $436,300 | $159,400 | $276,900 |
| 2022 | $3,667 | $363,400 | $141,100 | $222,300 |
| 2021 | $3,562 | $330,700 | $128,400 | $202,300 |
| 2020 | $3,469 | $323,000 | $127,200 | $195,800 |
| 2019 | $3,278 | $311,900 | $127,200 | $184,700 |
| 2018 | $3,151 | $299,000 | $121,100 | $177,900 |
| 2017 | $2,988 | $290,100 | $114,000 | $176,100 |
| 2016 | $2,882 | $283,700 | $114,000 | $169,700 |
| 2015 | $2,736 | $271,700 | $102,000 | $169,700 |
Source: Public Records
Map
Nearby Homes
- 18 Carlton Rd
- 203 County Rd
- 12 Beachwood Rd
- 18 Quaker Ln
- 13 Laurel Hill Ct
- 18 Douglas Ave
- 105 Clay Pond Rd
- 34 Turnberry Rd
- 12 Turnberry Rd Unit 12
- 16 Amberwood Ct
- 440 County Rd
- 30 Howard Ave
- 112 Clay Pond Rd
- 26 Carnoustie Rd
- 5 Sea Knoll Ct
- 4 Hollyhock Knoll Ct Unit 4
- 4 Hollyhock Knoll Ct Unit 4
- 1 Hollyhock Knoll Ct Unit 1
- 93 Valley Bars Rd