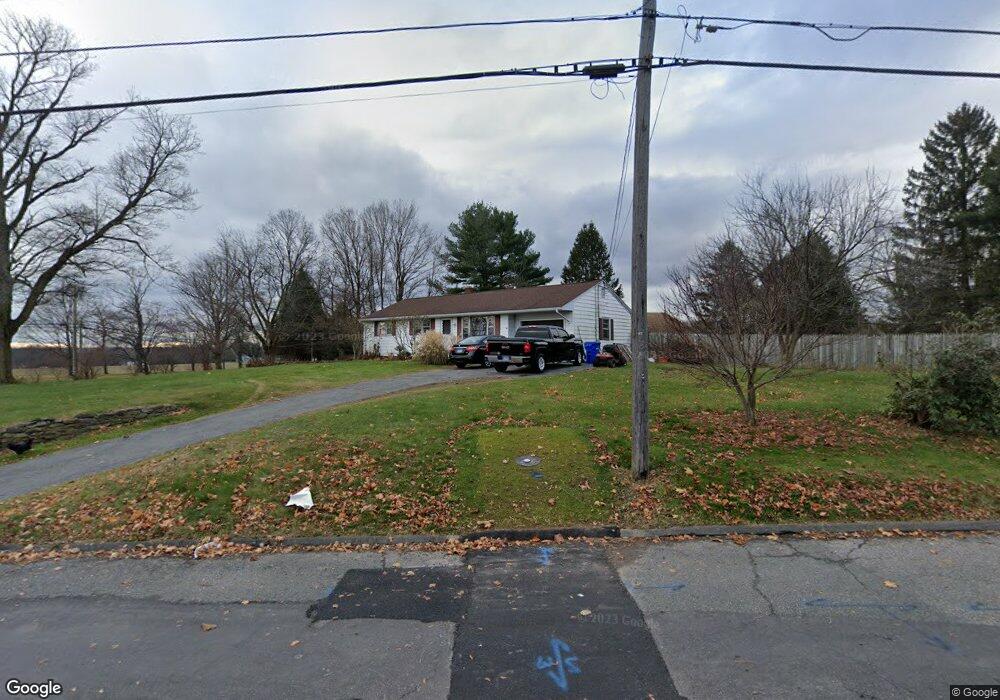
15 Mark Dr Coventry, CT 06238
Estimated Value: $277,000 - $311,165
3
Beds
2
Baths
1,008
Sq Ft
$297/Sq Ft
Est. Value
About This Home
This home is located at 15 Mark Dr, Coventry, CT 06238 and is currently estimated at $299,791, approximately $297 per square foot. 15 Mark Dr is a home located in Tolland County with nearby schools including Coventry Grammar School, George Hersey Robertson School, and Capt. Nathan Hale School.
Ownership History
Date
Name
Owned For
Owner Type
Purchase Details
Closed on
Aug 20, 2024
Sold by
Nadeau Jeannine G
Bought by
Nadeau Nicole
Current Estimated Value
Purchase Details
Closed on
Oct 1, 2019
Sold by
Nadeau Ronald R and Nadeau Jeannine G
Bought by
Nadeau Jeannine G
Purchase Details
Closed on
Oct 6, 2008
Sold by
Oswecki John C and Oswecki Stephanie A
Bought by
Lavanduski Steven E
Purchase Details
Closed on
Jun 2, 2003
Sold by
Montiel Laurel
Bought by
Oswecki John and Oswecki Stephanie
Home Financials for this Owner
Home Financials are based on the most recent Mortgage that was taken out on this home.
Original Mortgage
$156,000
Interest Rate
5.86%
Purchase Details
Closed on
Nov 19, 1998
Sold by
Green Walter and Green Elizabeth
Bought by
Montiel Laurel
Create a Home Valuation Report for This Property
The Home Valuation Report is an in-depth analysis detailing your home's value as well as a comparison with similar homes in the area
Home Values in the Area
Average Home Value in this Area
Purchase History
| Date | Buyer | Sale Price | Title Company |
|---|---|---|---|
| Nadeau Nicole | -- | None Available | |
| Nadeau Family Ct Prop T | -- | None Available | |
| Nadeau Nicole | -- | None Available | |
| Nadeau Jeannine G | -- | -- | |
| Nadeau Jeannine G | -- | -- | |
| Lavanduski Steven E | $198,000 | -- | |
| Oswecki John | $156,000 | -- | |
| Montiel Laurel | $119,000 | -- | |
| Lavanduski Steven E | $198,000 | -- | |
| Oswecki John | $156,000 | -- | |
| Montiel Laurel | $119,000 | -- |
Source: Public Records
Mortgage History
| Date | Status | Borrower | Loan Amount |
|---|---|---|---|
| Previous Owner | Montiel Laurel | $32,216 | |
| Previous Owner | Montiel Laurel | $13,658 | |
| Previous Owner | Montiel Laurel | $156,000 |
Source: Public Records
Tax History
| Year | Tax Paid | Tax Assessment Tax Assessment Total Assessment is a certain percentage of the fair market value that is determined by local assessors to be the total taxable value of land and additions on the property. | Land | Improvement |
|---|---|---|---|---|
| 2025 | $3,985 | $167,700 | $49,100 | $118,600 |
| 2024 | $3,508 | $105,300 | $40,600 | $64,700 |
| 2023 | $3,342 | $105,300 | $40,600 | $64,700 |
| 2022 | $3,280 | $105,300 | $40,600 | $64,700 |
| 2021 | $3,280 | $105,300 | $40,600 | $64,700 |
| 2020 | $3,282 | $105,300 | $40,600 | $64,700 |
| 2019 | $3,391 | $105,300 | $40,600 | $64,700 |
| 2018 | $3,333 | $103,500 | $40,600 | $62,900 |
| 2017 | $3,312 | $103,500 | $40,600 | $62,900 |
| 2016 | $3,229 | $103,500 | $40,600 | $62,900 |
| 2015 | $3,229 | $103,500 | $40,600 | $62,900 |
| 2014 | $3,328 | $116,900 | $49,500 | $67,400 |
Source: Public Records
Map
Nearby Homes
- 0 Boston Turnpike Unit 24128587
- 279 Mark Dr
- 25 Wolf Hill Rd
- 37 Wolf Hill Rd Unit Lot 40
- 37 Wolf Hill Lot (#40) Rd
- 395 Grant Hill (Mill Race Drive) Lot #21 Rd
- 395 Grant Hill Rd Unit Lot21
- 23 Neville St
- 5 Laurelwood Ln Unit lot 16
- 7 Laurelwood Ln Unit Lot 15
- 12 Laurelwood Ln Unit lot 8
- 864 Boston Turnpike
- 61 Stone Hedge Ln
- 939 Boston Turnpike
- 687 Hop River Rd
- 0 Skinner Hill Rd Unit 24077239
- 0 Rr 6 Route Unit 24048071
- 720 Bolton Rd
- 93 Dockerel Rd
- 8 Times Farm Rd
Your Personal Tour Guide
Ask me questions while you tour the home.