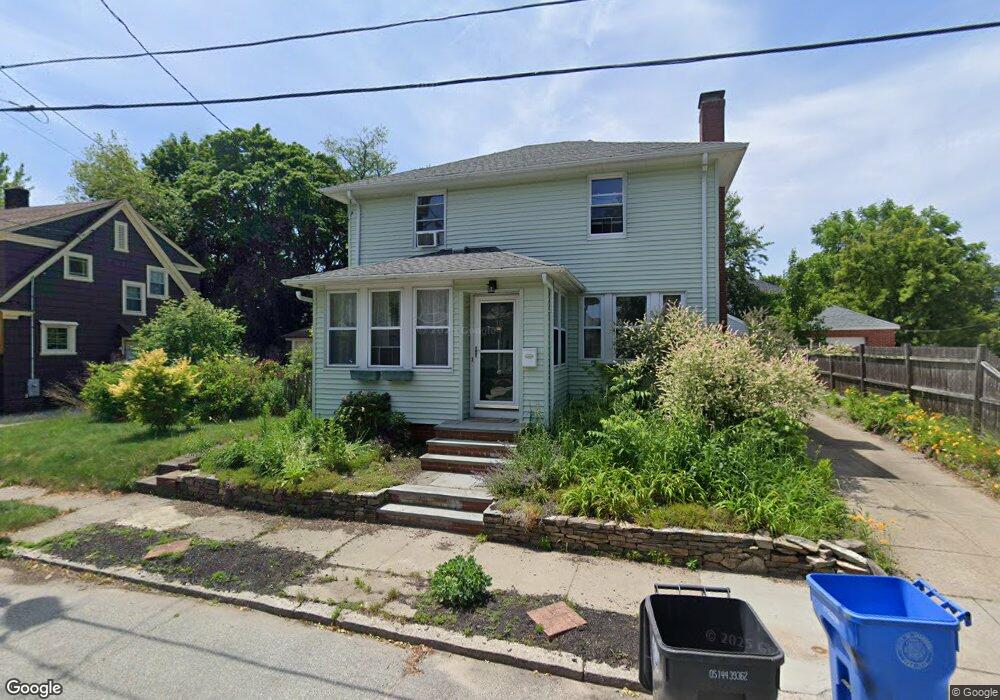
15 Mather Ave Cranston, RI 02905
Edgewood NeighborhoodEstimated Value: $426,000 - $510,000
3
Beds
2
Baths
1,417
Sq Ft
$335/Sq Ft
Est. Value
About This Home
This home is located at 15 Mather Ave, Cranston, RI 02905 and is currently estimated at $474,938, approximately $335 per square foot. 15 Mather Ave is a home located in Providence County with nearby schools including Edward S. Rhodes School, Park View Middle School, and Cranston High School East.
Ownership History
Date
Name
Owned For
Owner Type
Purchase Details
Closed on
Aug 16, 2005
Sold by
Boisse Brian C and Boisse Louise F
Bought by
Sorrell Kimberly A
Current Estimated Value
Home Financials for this Owner
Home Financials are based on the most recent Mortgage that was taken out on this home.
Original Mortgage
$40,000
Interest Rate
5.92%
Purchase Details
Closed on
May 4, 1998
Sold by
Gershkoff Robert S
Bought by
Boisse Brian C and Boisse Louise
Create a Home Valuation Report for This Property
The Home Valuation Report is an in-depth analysis detailing your home's value as well as a comparison with similar homes in the area
Home Values in the Area
Average Home Value in this Area
Purchase History
We collect this data history from publicly available records. To have your information removed, we recommend requesting removal directly through your county’s website.
| Date | Buyer | Sale Price | Title Company |
|---|---|---|---|
| Sorrell Kimberly A | $260,000 | -- | |
| Boisse Brian C | $82,000 | -- |
Source: Public Records
Mortgage History
We collect this data history from publicly available records. To have your information removed, we recommend requesting removal directly through your county’s website.
| Date | Status | Borrower | Loan Amount |
|---|---|---|---|
| Open | Boisse Brian C | $144,500 | |
| Closed | Boisse Brian C | $40,000 | |
| Closed | Boisse Brian C | $159,900 | |
| Previous Owner | Boisse Brian C | $16,000 |
Source: Public Records
Tax History
| Year | Tax Paid | Tax Assessment Tax Assessment Total Assessment is a certain percentage of the fair market value that is determined by local assessors to be the total taxable value of land and additions on the property. | Land | Improvement |
|---|---|---|---|---|
| 2025 | $4,775 | $344,000 | $110,700 | $233,300 |
| 2024 | $4,682 | $344,000 | $110,700 | $233,300 |
| 2023 | $4,579 | $242,300 | $72,900 | $169,400 |
| 2022 | $4,485 | $242,300 | $72,900 | $169,400 |
| 2021 | $4,361 | $242,300 | $72,900 | $169,400 |
| 2020 | $4,123 | $198,500 | $69,400 | $129,100 |
| 2019 | $4,123 | $198,500 | $69,400 | $129,100 |
| 2018 | $4,028 | $198,500 | $69,400 | $129,100 |
| 2017 | $3,904 | $170,200 | $62,500 | $107,700 |
| 2016 | $3,821 | $170,200 | $62,500 | $107,700 |
| 2015 | $3,727 | $166,000 | $62,500 | $103,500 |
| 2014 | $3,666 | $160,500 | $62,500 | $98,000 |
Source: Public Records
Map
Nearby Homes
- 18 Bow St
- 105 Park Ave
- 18 Harding Ave
- 28 Rosewood Ave
- 20 Henry St
- 150 Albert Ave
- 27 Cliffdale Ave
- 169 Arnold Ave Unit B
- 41 Berwick Ln
- 107 Massasoit Ave
- 19 Netherlands Ave
- 53 Edgewood Ave
- 31 Denver Ave
- 31 Windsor Rd Unit 1
- 1232 Narragansett Blvd
- 70 Tucker Ave
- 111 Roger Williams Cir
- 1200 Narragansett Blvd
- 25 Talbot Manor
- 1180 Narragansett Blvd Unit 1
Your Personal Tour Guide
Ask me questions while you tour the home.