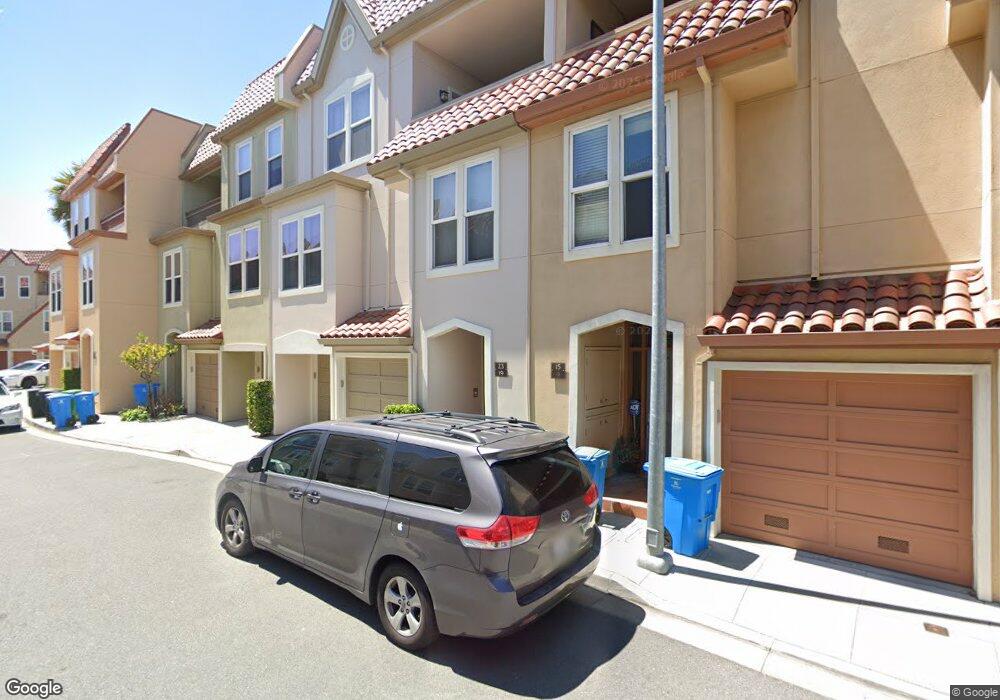
15 Megan Dr San Francisco, CA 94134
Little Hollywood NeighborhoodEstimated Value: $842,000 - $1,035,000
3
Beds
3
Baths
1,572
Sq Ft
$593/Sq Ft
Est. Value
About This Home
This home is located at 15 Megan Dr, San Francisco, CA 94134 and is currently estimated at $931,575, approximately $592 per square foot. 15 Megan Dr is a home located in San Francisco County with nearby schools including El Dorado Elementary School, Visitacion Valley Middle School, and KIPP Bayview Academy.
Ownership History
Date
Name
Owned For
Owner Type
Purchase Details
Closed on
Jan 13, 2025
Sold by
Kerns Francesco D B and Taft James M
Bought by
Kerns-Taft Family Revocable Living Trust and Taft
Current Estimated Value
Purchase Details
Closed on
Oct 8, 2014
Sold by
Kerns Francesco D B
Bought by
Kerns Francesco D B and Taft James M
Home Financials for this Owner
Home Financials are based on the most recent Mortgage that was taken out on this home.
Original Mortgage
$403,500
Interest Rate
4.08%
Mortgage Type
New Conventional
Purchase Details
Closed on
Apr 19, 2011
Sold by
Bay Side Vista Llc
Bought by
Kerns Francesco D B
Home Financials for this Owner
Home Financials are based on the most recent Mortgage that was taken out on this home.
Original Mortgage
$414,900
Interest Rate
4.77%
Mortgage Type
Purchase Money Mortgage
Create a Home Valuation Report for This Property
The Home Valuation Report is an in-depth analysis detailing your home's value as well as a comparison with similar homes in the area
Home Values in the Area
Average Home Value in this Area
Purchase History
| Date | Buyer | Sale Price | Title Company |
|---|---|---|---|
| Kerns-Taft Family Revocable Living Trust | -- | None Listed On Document | |
| Kerns Francesco D B | -- | Wfg Title Company | |
| Kerns Francesco D B | $461,000 | Old Republic Title Company |
Source: Public Records
Mortgage History
| Date | Status | Borrower | Loan Amount |
|---|---|---|---|
| Previous Owner | Kerns Francesco D B | $403,500 | |
| Previous Owner | Kerns Francesco D B | $414,900 |
Source: Public Records
Tax History Compared to Growth
Tax History
| Year | Tax Paid | Tax Assessment Tax Assessment Total Assessment is a certain percentage of the fair market value that is determined by local assessors to be the total taxable value of land and additions on the property. | Land | Improvement |
|---|---|---|---|---|
| 2025 | $7,490 | $590,608 | $354,366 | $236,242 |
| 2024 | $7,490 | $579,028 | $347,418 | $231,610 |
| 2023 | $7,369 | $567,675 | $340,606 | $227,069 |
| 2022 | $7,216 | $556,545 | $333,928 | $222,617 |
| 2021 | $7,083 | $545,633 | $327,381 | $218,252 |
| 2020 | $7,128 | $540,040 | $324,025 | $216,015 |
| 2019 | $6,886 | $529,452 | $317,672 | $211,780 |
| 2018 | $6,654 | $519,072 | $311,444 | $207,628 |
| 2017 | $6,276 | $508,895 | $305,338 | $203,557 |
| 2016 | $6,153 | $498,917 | $299,351 | $199,566 |
| 2015 | $6,074 | $491,424 | $294,855 | $196,569 |
| 2014 | $5,914 | $481,799 | $289,080 | $192,719 |
Source: Public Records
Map
Nearby Homes