15 Michael Dr Burlington, MA 01803
North Burlington NeighborhoodEstimated Value: $1,313,777 - $1,480,000
4
Beds
4
Baths
3,351
Sq Ft
$420/Sq Ft
Est. Value
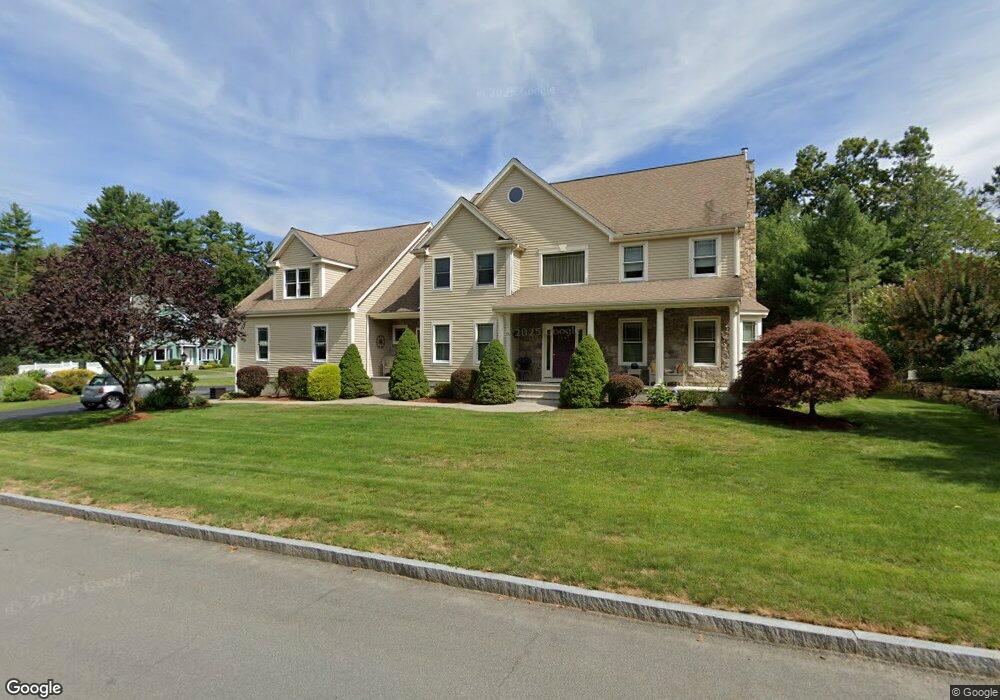
About This Home
This home is located at 15 Michael Dr, Burlington, MA 01803 and is currently estimated at $1,406,194, approximately $419 per square foot. 15 Michael Dr is a home located in Middlesex County with nearby schools including Burlington High School, Fox Hill, and Marshall Simonds Middle School.
Ownership History
Date
Name
Owned For
Owner Type
Purchase Details
Closed on
Dec 15, 2015
Sold by
Owens Kevin P and Owens Susan G
Bought by
15 Michael Drive Irt and Owens Kevin P
Current Estimated Value
Purchase Details
Closed on
May 15, 2000
Sold by
Ipswich Est T and Murray Robert W
Bought by
Owens Kevin P and Owens Susan G
Create a Home Valuation Report for This Property
The Home Valuation Report is an in-depth analysis detailing your home's value as well as a comparison with similar homes in the area
Home Values in the Area
Average Home Value in this Area
Purchase History
| Date | Buyer | Sale Price | Title Company |
|---|---|---|---|
| 15 Michael Drive Irt | -- | -- | |
| Owens Kevin P | $265,000 | -- |
Source: Public Records
Mortgage History
| Date | Status | Borrower | Loan Amount |
|---|---|---|---|
| Previous Owner | Owens Kevin P | $50,000 | |
| Previous Owner | Owens Kevin P | $250,000 |
Source: Public Records
Tax History Compared to Growth
Tax History
| Year | Tax Paid | Tax Assessment Tax Assessment Total Assessment is a certain percentage of the fair market value that is determined by local assessors to be the total taxable value of land and additions on the property. | Land | Improvement |
|---|---|---|---|---|
| 2025 | $10,818 | $1,249,200 | $460,100 | $789,100 |
| 2024 | $10,536 | $1,178,500 | $420,100 | $758,400 |
| 2023 | $10,418 | $1,108,300 | $364,100 | $744,200 |
| 2022 | $10,041 | $1,009,100 | $331,100 | $678,000 |
| 2021 | $9,881 | $993,100 | $315,100 | $678,000 |
| 2020 | $9,525 | $988,100 | $310,100 | $678,000 |
| 2019 | $9,458 | $902,500 | $290,100 | $612,400 |
| 2018 | $9,585 | $902,500 | $290,100 | $612,400 |
| 2017 | $4,944 | $902,500 | $290,100 | $612,400 |
| 2016 | $9,374 | $818,000 | $250,100 | $567,900 |
| 2015 | $9,284 | $818,000 | $250,100 | $567,900 |
| 2014 | $9,300 | $775,000 | $216,100 | $558,900 |
Source: Public Records
Map
Nearby Homes