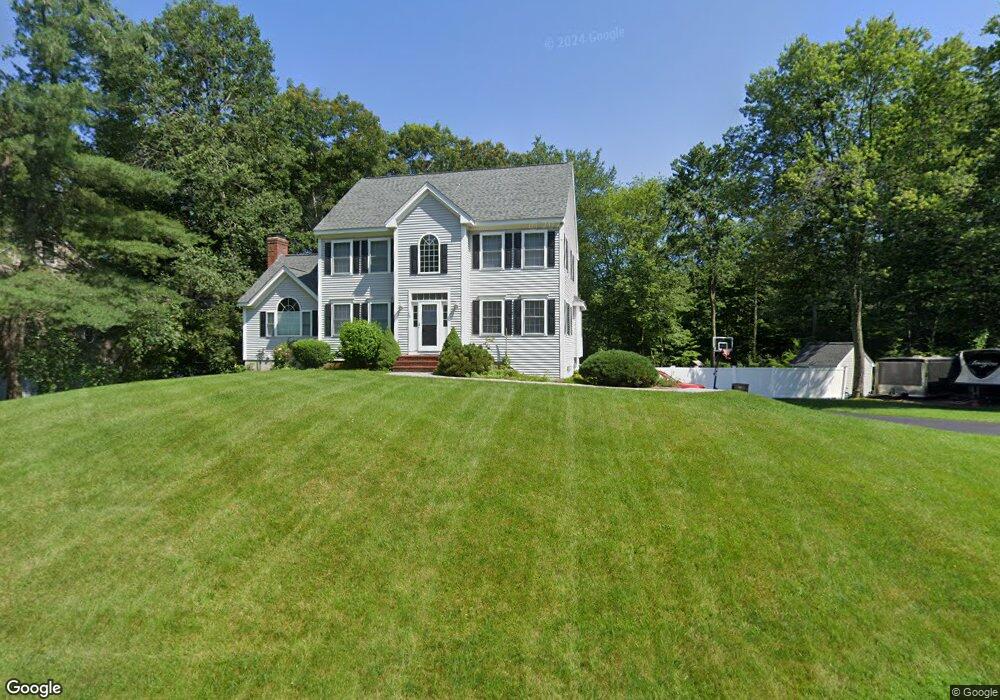
15 Mill Stream Dr Atkinson, NH 03811
Estimated Value: $679,292 - $932,000
3
Beds
3
Baths
2,350
Sq Ft
$348/Sq Ft
Est. Value
About This Home
This home is located at 15 Mill Stream Dr, Atkinson, NH 03811 and is currently estimated at $818,573, approximately $348 per square foot. 15 Mill Stream Dr is a home located in Rockingham County with nearby schools including Atkinson Academy, Timberlane Regional Middle School, and Timberlane Regional High School.
Ownership History
Date
Name
Owned For
Owner Type
Purchase Details
Closed on
Oct 17, 2021
Sold by
Sirois Jason S and Sirois Kelly M
Bought by
Sirois Jason A and Sirois Kelly M
Current Estimated Value
Purchase Details
Closed on
Jul 19, 2011
Sold by
Dumont Dana J and Dumont Margaret L
Bought by
Sirois Jason S and Gilmartin Kelly M
Home Financials for this Owner
Home Financials are based on the most recent Mortgage that was taken out on this home.
Original Mortgage
$332,500
Interest Rate
4.58%
Mortgage Type
Purchase Money Mortgage
Purchase Details
Closed on
Mar 17, 2000
Sold by
Lemery Building Co Inc
Bought by
Dumont Dana J and Dumont Margaret L
Home Financials for this Owner
Home Financials are based on the most recent Mortgage that was taken out on this home.
Original Mortgage
$90,000
Interest Rate
8.24%
Create a Home Valuation Report for This Property
The Home Valuation Report is an in-depth analysis detailing your home's value as well as a comparison with similar homes in the area
Home Values in the Area
Average Home Value in this Area
Purchase History
| Date | Buyer | Sale Price | Title Company |
|---|---|---|---|
| Sirois Jason A | -- | None Available | |
| Sirois Jason S | $350,000 | -- | |
| Dumont Dana J | $259,300 | -- |
Source: Public Records
Mortgage History
| Date | Status | Borrower | Loan Amount |
|---|---|---|---|
| Previous Owner | Dumont Dana J | $332,500 | |
| Previous Owner | Dumont Dana J | $90,000 |
Source: Public Records
Tax History Compared to Growth
Tax History
| Year | Tax Paid | Tax Assessment Tax Assessment Total Assessment is a certain percentage of the fair market value that is determined by local assessors to be the total taxable value of land and additions on the property. | Land | Improvement |
|---|---|---|---|---|
| 2024 | $7,366 | $570,100 | $257,300 | $312,800 |
| 2023 | $8,266 | $570,100 | $257,300 | $312,800 |
| 2022 | $6,995 | $570,100 | $257,300 | $312,800 |
| 2021 | $7,046 | $570,100 | $257,300 | $312,800 |
| 2020 | $2 | $366,900 | $171,500 | $195,400 |
| 2019 | $6,483 | $366,900 | $171,500 | $195,400 |
| 2018 | $9,501 | $355,900 | $171,500 | $184,400 |
| 2017 | $108 | $355,900 | $171,500 | $184,400 |
| 2016 | $3,857 | $355,900 | $171,500 | $184,400 |
| 2015 | $6,368 | $333,400 | $165,800 | $167,600 |
| 2014 | $6,368 | $333,400 | $165,800 | $167,600 |
| 2013 | $6,251 | $329,000 | $165,800 | $163,200 |
Source: Public Records
Map
Nearby Homes
- 41 Westside Dr
- 7 Oak Ridge Dr
- 3 Providence Hill Rd
- 27 Village Dr
- 10 Old Coach Rd
- 27 Norwood Rd
- 7 Longview Dr Unit 105
- 20 Chandler Dr
- Massabesic Plan at Atkinson Heights
- Jenness Plan at Atkinson Heights
- Gloucester Plan at Atkinson Heights
- Berkshire Plan at Atkinson Heights
- Allagash Plan at Atkinson Heights
- Franconia Plan at Atkinson Heights
- Dartmouth Plan at Atkinson Heights
- Exeter Plan at Atkinson Heights
- Lincoln Plan at Atkinson Heights
- Kinsmen Plan at Atkinson Heights
- Hampton Plan at Atkinson Heights
- Cardigan Plan at Atkinson Heights
- 11 Mill Stream Dr
- 18 Mill Stream Dr
- 16 Mill Stream Dr
- 19 Mill Stream Dr
- 14 Mill Stream Dr
- 20 Mill Stream Dr
- 5 Hitchcock Ln
- 12 Mill Stream Dr
- 9 Mill Stream Dr
- 21 Mill Stream Dr
- 8 Hitchcock Ln
- 10 Mill Stream Dr
- 10 Winslow Dr
- 10 Winslow Dr Unit 4
- 7 Hitchcock Ln
- 26 Mill Stream Dr
- 7 Mill Stream Dr
- 11 Oak Hill Cir
- 13 Oak Hill Cir
- 8 Mill Stream Dr