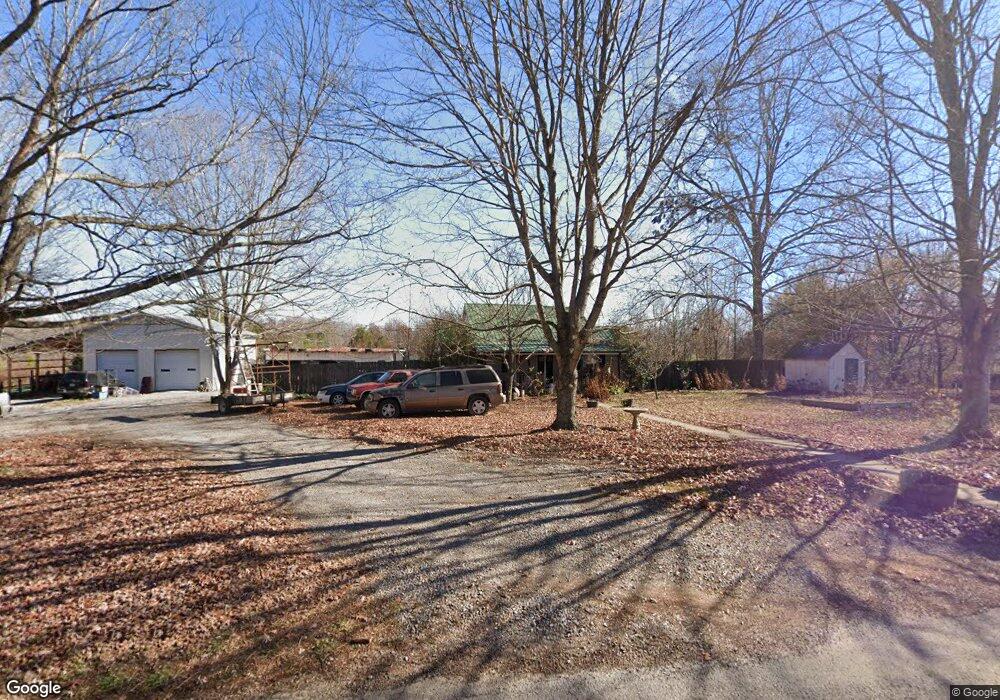
15 N Howard Fitch Rd Kelso, TN 37348
Estimated Value: $142,755 - $212,000
--
Bed
1
Bath
1,229
Sq Ft
$147/Sq Ft
Est. Value
About This Home
This home is located at 15 N Howard Fitch Rd, Kelso, TN 37348 and is currently estimated at $180,439, approximately $146 per square foot. 15 N Howard Fitch Rd is a home located in Lincoln County with nearby schools including Flintville School, Lincoln Central Academy, and Lincoln County High School.
Ownership History
Date
Name
Owned For
Owner Type
Purchase Details
Closed on
Aug 1, 2008
Sold by
Della Becker
Bought by
Sarah Baker
Current Estimated Value
Purchase Details
Closed on
Feb 16, 2007
Sold by
Newman William R
Bought by
Billy Honey
Purchase Details
Closed on
May 22, 2006
Bought by
Becker Della %First Franklin Ste #200
Purchase Details
Closed on
May 8, 2000
Sold by
Smith James S
Bought by
Parksjeffery B
Purchase Details
Closed on
Apr 28, 2000
Bought by
Parks Jeffery B
Purchase Details
Closed on
Nov 19, 1998
Sold by
Smith James S
Bought by
Smith Kathy D
Purchase Details
Closed on
Oct 10, 1995
Bought by
Smith James S
Purchase Details
Closed on
Feb 13, 1995
Sold by
Gray Beckie R
Bought by
Gray Beckie R
Purchase Details
Closed on
Dec 19, 1975
Bought by
Gray Fred T and Gray Gloria H
Create a Home Valuation Report for This Property
The Home Valuation Report is an in-depth analysis detailing your home's value as well as a comparison with similar homes in the area
Home Values in the Area
Average Home Value in this Area
Purchase History
| Date | Buyer | Sale Price | Title Company |
|---|---|---|---|
| Sarah Baker | $71,750 | -- | |
| Sarah Baker | $71,750 | -- | |
| Billy Honey | $67,500 | -- | |
| Becker Della %First Franklin Ste #200 | $46,100 | -- | |
| Becker Della %First Franklin Ste #200 | $46,100 | -- | |
| Parksjeffery B | $12,500 | -- | |
| Parksjeffery B | $12,500 | -- | |
| Parks Jeffery B | $87,000 | -- | |
| Parks Jeffery B | $87,000 | -- | |
| Smith Kathy D | -- | -- | |
| Smith Kathy D | -- | -- | |
| Smith James S | $25,000 | -- | |
| Smith James S | $25,000 | -- | |
| Gray Beckie R | $51,000 | -- | |
| Gray Beckie R | $51,000 | -- | |
| Gray Fred T | -- | -- |
Source: Public Records
Tax History Compared to Growth
Tax History
| Year | Tax Paid | Tax Assessment Tax Assessment Total Assessment is a certain percentage of the fair market value that is determined by local assessors to be the total taxable value of land and additions on the property. | Land | Improvement |
|---|---|---|---|---|
| 2024 | $629 | $33,125 | $7,225 | $25,900 |
| 2023 | $560 | $19,425 | $2,600 | $16,825 |
| 2022 | $408 | $19,425 | $2,600 | $16,825 |
| 2021 | $408 | $19,425 | $2,600 | $16,825 |
| 2020 | $408 | $19,425 | $2,600 | $16,825 |
| 2019 | $408 | $19,425 | $2,600 | $16,825 |
| 2018 | $391 | $15,750 | $2,300 | $13,450 |
| 2017 | $369 | $15,750 | $2,300 | $13,450 |
| 2016 | $369 | $15,750 | $2,300 | $13,450 |
| 2015 | -- | $15,750 | $2,300 | $13,450 |
| 2014 | $228 | $11,650 | $2,300 | $9,350 |
Source: Public Records
Map
Nearby Homes
- 3 Boone Dr
- 34 Teal Hollow Dr
- 0 Lees Creek Rd Unit RTC2976033
- 96 Crystal Springs Rd
- 315 Old Lincoln Rd
- 12 Dukes Ln
- 7 Elizabeth Cir
- 7 Summerfield Dr
- 15 Emma May Dr
- 51 Hunters Ridge Dr
- 0 Winchester Hwy Unit RTC2941519
- 0 Winchester Hwy Unit RTC2914832
- 0 Winchester Hwy Unit RTC2883219
- 13 Cedar Grove Dr
- 6 Teal Hollow Rd
- 0 Teal Hollow Rd Unit RTC2914929
- 37 Lackey Rd
- 2176 Winchester Hwy
- 56 Rambo Rd Unit 106
- 168 Oliver Smith Rd
- 5 Tulip Ln
- 10 N Howard Fitch Rd
- 8 N Howard Fitch Rd
- 6 N Howard Fitch Rd
- 4 N Howard Fitch Rd
- 2 N Howard Fitch Rd
- 27 N Howard Fitch Rd
- 344 Lees Creek Rd
- 274 Howell Hill Rd
- 286 Howell Hill Rd
- 257 Howell Hill Rd
- 277 Howell Hill Rd
- 6B S Howard Fitch Rd
- 6B S Howard Fitch Rd
- 6 S Howard Fitch Rd
- 8 S Howard Fitch Rd
- 8C S Howard Fitch Rd
- 8B S Howard Fitch Rd
- 283 Howell Hill Rd
- 332 Lees Creek Rd