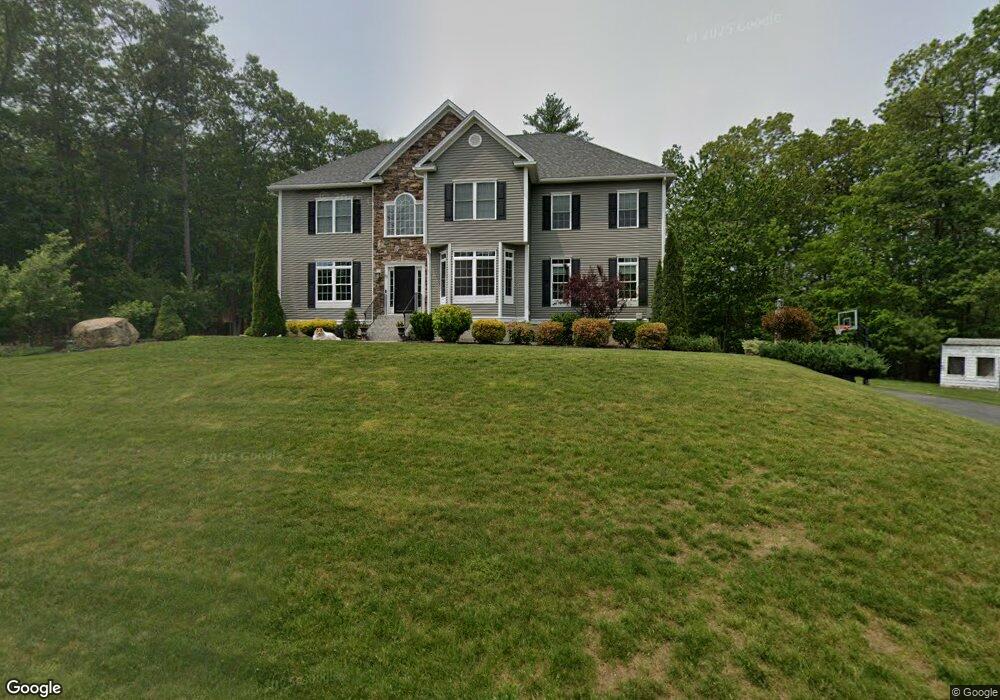
15 Nathan Rd Windham, NH 03087
Estimated Value: $1,188,191 - $1,537,000
4
Beds
3
Baths
3,556
Sq Ft
$392/Sq Ft
Est. Value
About This Home
This home is located at 15 Nathan Rd, Windham, NH 03087 and is currently estimated at $1,394,048, approximately $392 per square foot. 15 Nathan Rd is a home located in Rockingham County with nearby schools including Golden Brook Elementary School, Windham Middle School, and Windham High School.
Ownership History
Date
Name
Owned For
Owner Type
Purchase Details
Closed on
Apr 11, 2016
Sold by
H&B Homes Corp
Bought by
Aldrich Jonathan and Aldrich Jaclyn
Current Estimated Value
Home Financials for this Owner
Home Financials are based on the most recent Mortgage that was taken out on this home.
Original Mortgage
$589,600
Outstanding Balance
$467,477
Interest Rate
3.62%
Mortgage Type
Purchase Money Mortgage
Estimated Equity
$926,571
Create a Home Valuation Report for This Property
The Home Valuation Report is an in-depth analysis detailing your home's value as well as a comparison with similar homes in the area
Home Values in the Area
Average Home Value in this Area
Purchase History
| Date | Buyer | Sale Price | Title Company |
|---|---|---|---|
| Aldrich Jonathan | $675,000 | -- |
Source: Public Records
Mortgage History
| Date | Status | Borrower | Loan Amount |
|---|---|---|---|
| Open | Aldrich Jonathan | $589,600 |
Source: Public Records
Tax History
| Year | Tax Paid | Tax Assessment Tax Assessment Total Assessment is a certain percentage of the fair market value that is determined by local assessors to be the total taxable value of land and additions on the property. | Land | Improvement |
|---|---|---|---|---|
| 2024 | $18,368 | $811,300 | $195,000 | $616,300 |
| 2023 | $16,495 | $770,800 | $195,000 | $575,800 |
| 2022 | $15,549 | $786,900 | $195,000 | $591,900 |
| 2021 | $14,652 | $786,900 | $195,000 | $591,900 |
| 2020 | $15,053 | $786,900 | $195,000 | $591,900 |
| 2019 | $14,067 | $623,800 | $179,000 | $444,800 |
| 2018 | $14,528 | $623,800 | $179,000 | $444,800 |
| 2017 | $12,601 | $623,800 | $179,000 | $444,800 |
| 2016 | $13,308 | $609,900 | $179,000 | $430,900 |
| 2015 | $3,888 | $179,000 | $179,000 | $0 |
| 2014 | $4,032 | $168,000 | $168,000 | $0 |
| 2013 | -- | $0 | $0 | $0 |
Source: Public Records
Map
Nearby Homes
- 13 Kilrea Rd Unit L
- 242 Rockingham Rd
- 4 Westview Dr
- 7 Lilac Ridge Rd
- 16 Towne Dr
- 39 Overton Rd
- 3 Evergreen Way Unit End unit
- 106 N Lowell Rd
- 5 Craven Terrace
- 24 Rockingham Rd
- 21 Berry Rd
- 45 Trails Edge Rd
- 53 Trails Edge Rd
- 55 Trails Edge Rd
- 5 Stone Fence Dr
- 139 Rockingham Rd Unit 21
- 14 Londonderry Rd
- 144 Rockingham Rd
- 8 Blueberry Rd Unit U: R
- 2 Mulberry St
Your Personal Tour Guide
Ask me questions while you tour the home.