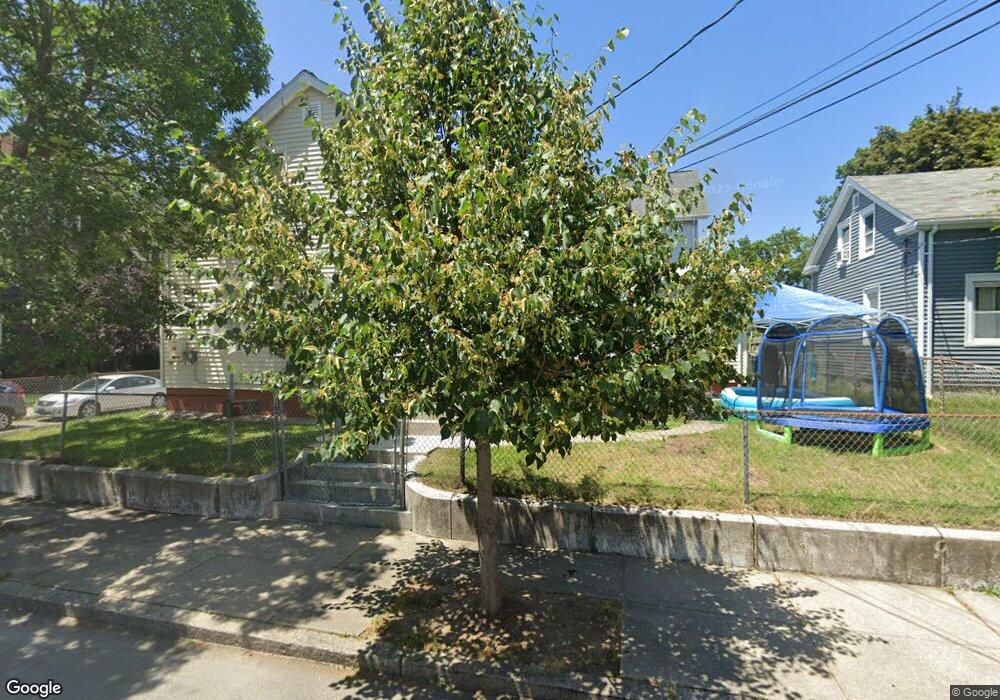
15 Nickerson St Pawtucket, RI 02860
Downtown Pawtucket NeighborhoodEstimated Value: $406,262 - $633,000
4
Beds
3
Baths
2,082
Sq Ft
$242/Sq Ft
Est. Value
About This Home
This home is located at 15 Nickerson St, Pawtucket, RI 02860 and is currently estimated at $503,566, approximately $241 per square foot. 15 Nickerson St is a home located in Providence County with nearby schools including Blackstone Valley Prep Junior High School.
Ownership History
Date
Name
Owned For
Owner Type
Purchase Details
Closed on
Sep 11, 1998
Sold by
Pawt Citizens Dev Corp
Bought by
Vazquez Andres and Negron Ruth
Current Estimated Value
Home Financials for this Owner
Home Financials are based on the most recent Mortgage that was taken out on this home.
Original Mortgage
$74,600
Outstanding Balance
$14,348
Interest Rate
6.92%
Estimated Equity
$489,218
Purchase Details
Closed on
Oct 22, 1996
Sold by
Tc Bldrs & Dev Inc
Bought by
Pawtucket Dev Corp
Create a Home Valuation Report for This Property
The Home Valuation Report is an in-depth analysis detailing your home's value as well as a comparison with similar homes in the area
Home Values in the Area
Average Home Value in this Area
Purchase History
| Date | Buyer | Sale Price | Title Company |
|---|---|---|---|
| Vazquez Andres | $75,000 | -- | |
| Pawtucket Dev Corp | $25,500 | -- |
Source: Public Records
Mortgage History
| Date | Status | Borrower | Loan Amount |
|---|---|---|---|
| Open | Pawtucket Dev Corp | $74,600 | |
| Previous Owner | Pawtucket Dev Corp | $71,100 |
Source: Public Records
Tax History
| Year | Tax Paid | Tax Assessment Tax Assessment Total Assessment is a certain percentage of the fair market value that is determined by local assessors to be the total taxable value of land and additions on the property. | Land | Improvement |
|---|---|---|---|---|
| 2025 | $4,604 | $350,100 | $80,500 | $269,600 |
| 2024 | $4,320 | $350,100 | $80,500 | $269,600 |
| 2023 | $3,845 | $227,000 | $35,100 | $191,900 |
| 2022 | $3,764 | $227,000 | $35,100 | $191,900 |
| 2021 | $3,764 | $227,000 | $35,100 | $191,900 |
| 2020 | $3,606 | $172,600 | $43,900 | $128,700 |
| 2019 | $3,606 | $172,600 | $43,900 | $128,700 |
| 2018 | $3,474 | $172,600 | $43,900 | $128,700 |
| 2017 | $3,117 | $137,200 | $38,400 | $98,800 |
| 2016 | $3,003 | $137,200 | $38,400 | $98,800 |
| 2015 | $3,003 | $137,200 | $38,400 | $98,800 |
| 2014 | $2,970 | $128,800 | $38,400 | $90,400 |
Source: Public Records
Map
Nearby Homes
- 78 Barton St
- 84 Barton St
- 88 Barton St
- 140 Dexter St
- 234 Central St Unit 236
- 256 High St
- 396 Roosevelt Ave
- 35 Rand St
- 28 Bayley St Unit 107
- 517 High St
- 511 High St
- 7 Fales St
- 30 Foundry St Unit 6
- 300 Front St Unit 409
- 108 Sumner Ave
- 45 Harrison St
- 14 Martin Ct
- 722 Dexter St Unit 726
- 66 Perry St
- 17 Beecher St
Your Personal Tour Guide
Ask me questions while you tour the home.