Estimated Value: $538,000 - $664,000
3
Beds
2
Baths
1,186
Sq Ft
$493/Sq Ft
Est. Value
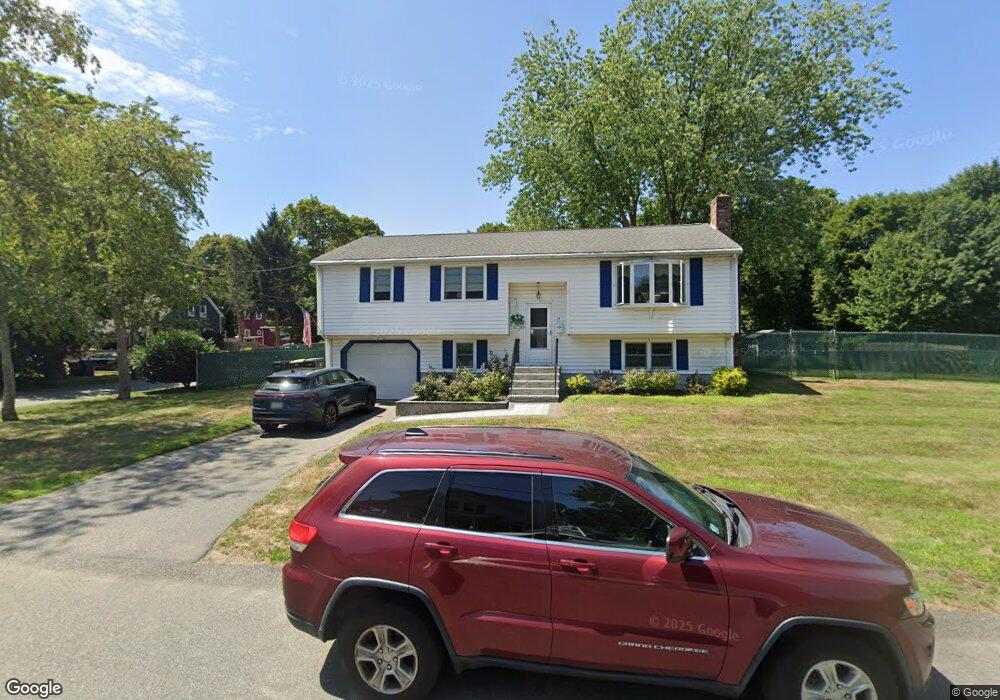
About This Home
This home is located at 15 Old Pratt St, Avon, MA 02322 and is currently estimated at $585,240, approximately $493 per square foot. 15 Old Pratt St is a home located in Norfolk County with nearby schools including Ralph D. Butler Elementary School and Avon Middle/High School.
Ownership History
Date
Name
Owned For
Owner Type
Purchase Details
Closed on
Aug 26, 1992
Sold by
Jain Harish K and Jain Kamal H
Bought by
Morris Donna J
Current Estimated Value
Home Financials for this Owner
Home Financials are based on the most recent Mortgage that was taken out on this home.
Original Mortgage
$137,700
Interest Rate
8.09%
Mortgage Type
Purchase Money Mortgage
Create a Home Valuation Report for This Property
The Home Valuation Report is an in-depth analysis detailing your home's value as well as a comparison with similar homes in the area
Home Values in the Area
Average Home Value in this Area
Purchase History
| Date | Buyer | Sale Price | Title Company |
|---|---|---|---|
| Morris Donna J | $145,000 | -- |
Source: Public Records
Mortgage History
| Date | Status | Borrower | Loan Amount |
|---|---|---|---|
| Open | Morris Donna J | $25,000 | |
| Open | Morris Donna J | $194,118 | |
| Closed | Morris Donna J | $134,000 | |
| Closed | Morris Donna J | $137,700 |
Source: Public Records
Tax History
| Year | Tax Paid | Tax Assessment Tax Assessment Total Assessment is a certain percentage of the fair market value that is determined by local assessors to be the total taxable value of land and additions on the property. | Land | Improvement |
|---|---|---|---|---|
| 2025 | $67 | $503,100 | $193,300 | $309,800 |
| 2024 | $6,243 | $445,000 | $183,300 | $261,700 |
| 2023 | $6,061 | $445,000 | $183,300 | $261,700 |
| 2022 | $6,416 | $405,800 | $152,800 | $253,000 |
| 2021 | $6,084 | $362,600 | $138,700 | $223,900 |
| 2020 | $5,726 | $323,500 | $136,000 | $187,500 |
| 2019 | $5,654 | $314,300 | $136,000 | $178,300 |
| 2018 | $5,945 | $320,500 | $136,000 | $184,500 |
| 2017 | $4,868 | $281,700 | $136,000 | $145,700 |
| 2016 | $4,947 | $289,100 | $136,000 | $153,100 |
| 2015 | $4,422 | $270,100 | $123,600 | $146,500 |
Source: Public Records
Map
Nearby Homes
Your Personal Tour Guide
Ask me questions while you tour the home.