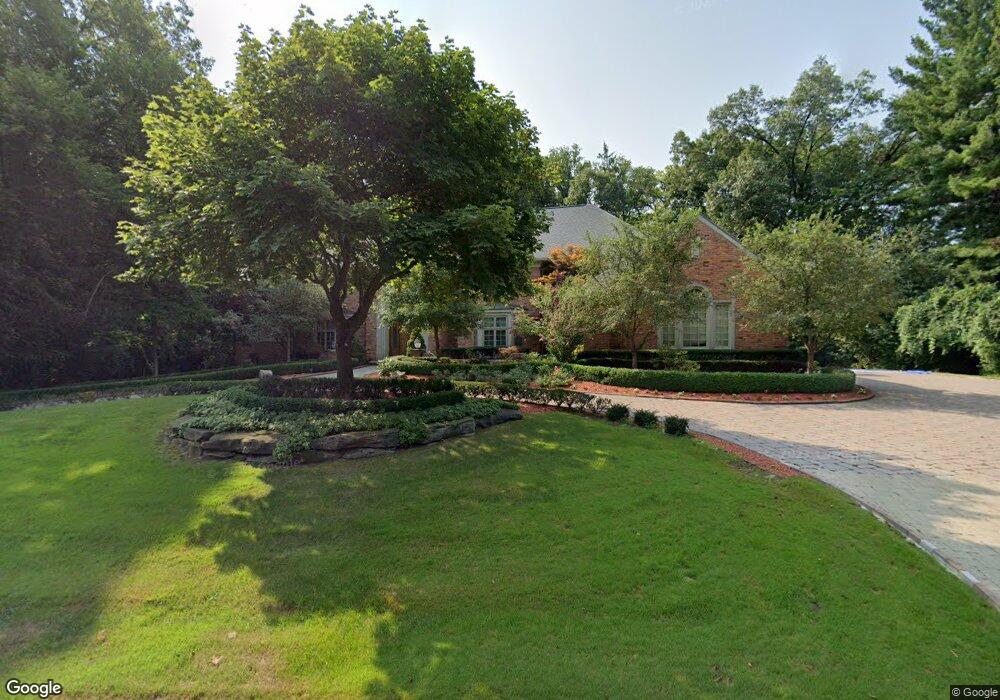
15 Pine Gate Dr Bloomfield Hills, MI 48304
Estimated Value: $2,358,000 - $2,401,097
5
Beds
9
Baths
7,387
Sq Ft
$321/Sq Ft
Est. Value
About This Home
This home is located at 15 Pine Gate Dr, Bloomfield Hills, MI 48304 and is currently estimated at $2,373,032, approximately $321 per square foot. 15 Pine Gate Dr is a home located in Oakland County with nearby schools including Way Elementary School, South Hills Middle School, and Bloomfield Hills High School.
Ownership History
Date
Name
Owned For
Owner Type
Purchase Details
Closed on
Mar 8, 2021
Sold by
Thavarajah Sumeska and Thavarajah Indrajit
Bought by
Kalas Tom and Kalas Nickalene
Current Estimated Value
Purchase Details
Closed on
Sep 9, 2019
Sold by
Thavarajah Krishna
Bought by
Thavarajah Krishna and Krishna Thavarajah Irrevocable
Purchase Details
Closed on
Oct 18, 2010
Sold by
Thavarajah Sumeska and Thavarajah Krishna
Bought by
Thavarajah Sumeska and Thavarajah Krishna
Purchase Details
Closed on
Jun 16, 2003
Sold by
Thavarajah Puvaneswary and Thavarajah Krishnapillai
Bought by
Thavarajah Sumeska and Thavarajah Krishna
Purchase Details
Closed on
Mar 20, 1998
Sold by
Thavarajah Puvaneswary
Bought by
Krishnapilla Thavarajah Tr
Create a Home Valuation Report for This Property
The Home Valuation Report is an in-depth analysis detailing your home's value as well as a comparison with similar homes in the area
Home Values in the Area
Average Home Value in this Area
Purchase History
| Date | Buyer | Sale Price | Title Company |
|---|---|---|---|
| Kalas Tom | -- | Legacy Title Agency | |
| Thavarajah Krishna | -- | None Available | |
| Thavarajah Sumeska | -- | None Available | |
| Thavarajah Sumeska | -- | None Available | |
| Thavarajah Sumeska | -- | -- | |
| Thavarajah Puvaneswary | -- | -- | |
| Krishnapilla Thavarajah Tr | -- | -- |
Source: Public Records
Tax History Compared to Growth
Tax History
| Year | Tax Paid | Tax Assessment Tax Assessment Total Assessment is a certain percentage of the fair market value that is determined by local assessors to be the total taxable value of land and additions on the property. | Land | Improvement |
|---|---|---|---|---|
| 2024 | $23,166 | $887,870 | $0 | $0 |
| 2023 | $22,286 | $780,970 | $0 | $0 |
| 2022 | $25,766 | $710,510 | $0 | $0 |
| 2021 | $25,818 | $715,510 | $0 | $0 |
| 2020 | $31,102 | $1,084,460 | $0 | $0 |
| 2019 | $35,069 | $1,081,550 | $0 | $0 |
| 2018 | $35,165 | $1,119,180 | $0 | $0 |
| 2017 | $34,800 | $1,113,430 | $0 | $0 |
| 2016 | $34,682 | $1,056,410 | $0 | $0 |
| 2015 | -- | $1,014,890 | $0 | $0 |
| 2014 | -- | $979,980 | $0 | $0 |
| 2011 | -- | $916,440 | $0 | $0 |
Source: Public Records
Map
Nearby Homes
- 965 Bloomfield Woods Unit 4
- 969 Bloomfield Woods
- 40 Scenic Oaks Dr N
- 2389 Hickory Glen Dr Unit F19
- 2474 Hickory Glen Dr Unit G22
- 41350 Woodward Ave Unit 8
- 40740 Woodward Ave Unit 38
- 1900 Tiverton Rd
- 559 Barrington Park
- 112 E Hickory Grove Rd Unit 26
- 2993 Aldgate Dr
- 521 Kingsley Trail
- 510 Hunters Crossing
- 229 Barden Rd
- 63 Barden Ct
- 150 E Long Lake Rd Unit 5
- 130 Denbar Rd
- 42160 Woodward Ave Unit 8
- 42160 Woodward Ave
- 110 Denbar Rd
- 981 Bloomfield Woods Unit Bldg-Unit
- 977 Bloomfield Woods Unit 10
- 7 Pine Gate Ct
- 23 Pine Gate Dr Unit Bldg-Unit
- 23 Pine Gate Dr
- 1900 E Valley Rd Unit Bldg-Unit
- 1900 E Valley Rd
- 9 Pine Gate Ct
- 961 Bloomfield Woods
- 957 Bloomfield Woods
- 5 Pine Gate Ct
- 973 Bloomfield Woods
- 3 Pine Gate Ct
- 37 Pine Gate Dr
- 949 Bloomfield Woods
- 1880 E Valley Rd
- 953 Bloomfield Woods
- 36 Pine Gate Dr
- 1931 E Valley Rd
- 945 Bloomfield Woods