15 Po Box Saybrook, IL 61770
Estimated Value: $135,000 - $147,000
--
Bed
1
Bath
936
Sq Ft
$151/Sq Ft
Est. Value
About This Home
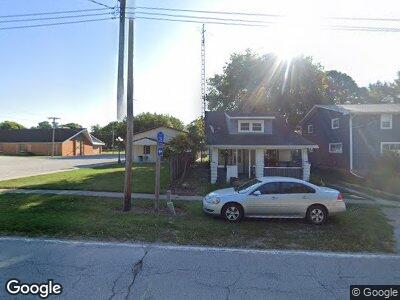
This home is located at 15 Po Box, Saybrook, IL 61770 and is currently estimated at $140,888, approximately $150 per square foot. 15 Po Box is a home located in McLean County with nearby schools including Ridgeview Elementary School and Ridgeview High School.
Ownership History
Date
Name
Owned For
Owner Type
Purchase Details
Closed on
Jul 1, 2024
Sold by
Sattler Gage Phillip and Sattler Kaitlyn
Bought by
Carnahan Chad
Current Estimated Value
Home Financials for this Owner
Home Financials are based on the most recent Mortgage that was taken out on this home.
Original Mortgage
$114,400
Outstanding Balance
$114,114
Interest Rate
6.94%
Mortgage Type
New Conventional
Estimated Equity
$28,268
Purchase Details
Closed on
Jan 19, 2022
Sold by
Joyce A Gibbens Revocable Trust
Bought by
Sattler Gage
Home Financials for this Owner
Home Financials are based on the most recent Mortgage that was taken out on this home.
Original Mortgage
$106,500
Interest Rate
3.63%
Mortgage Type
New Conventional
Purchase Details
Closed on
Sep 27, 2021
Sold by
Gibbens Joyce A and Gibbens William F
Bought by
Gibbens Joyce A and Joyce A Gibbens Revocable Trus
Purchase Details
Closed on
Dec 14, 2020
Sold by
Gallo Dorothy L and Lewis Randy Thomas
Bought by
Gibbens William F and Gibbens Joyce A
Create a Home Valuation Report for This Property
The Home Valuation Report is an in-depth analysis detailing your home's value as well as a comparison with similar homes in the area
Home Values in the Area
Average Home Value in this Area
Purchase History
| Date | Buyer | Sale Price | Title Company |
|---|---|---|---|
| Carnahan Chad | $143,000 | Alliance Land Title | |
| Sattler Gage | $125,000 | None Listed On Document | |
| Sattler Gage | $125,000 | None Listed On Document | |
| Gibbens Joyce A | -- | None Available | |
| Gibbens William F | $45,000 | Attorney |
Source: Public Records
Mortgage History
| Date | Status | Borrower | Loan Amount |
|---|---|---|---|
| Open | Carnahan Chad | $114,400 | |
| Previous Owner | Sattler Gage | $106,500 | |
| Previous Owner | Gallo Dorothy L | $61,704 |
Source: Public Records
Tax History Compared to Growth
Tax History
| Year | Tax Paid | Tax Assessment Tax Assessment Total Assessment is a certain percentage of the fair market value that is determined by local assessors to be the total taxable value of land and additions on the property. | Land | Improvement |
|---|---|---|---|---|
| 2022 | $2,808 | $31,512 | $2,726 | $28,786 |
| 2021 | $2,060 | $22,988 | $2,726 | $20,262 |
| 2020 | $507 | $22,633 | $2,684 | $19,949 |
| 2019 | $1,048 | $22,633 | $2,684 | $19,949 |
| 2018 | $494 | $21,640 | $2,566 | $19,074 |
| 2017 | $494 | $21,640 | $2,566 | $19,074 |
| 2016 | $901 | $21,233 | $2,518 | $18,715 |
| 2015 | $499 | $19,995 | $2,371 | $17,624 |
| 2014 | $490 | $19,134 | $2,269 | $16,865 |
| 2013 | -- | $20,692 | $2,454 | $18,238 |
Source: Public Records
Map
Nearby Homes
- 106 S Madison St
- 402 Grove St
- 505 S Main St
- 12584 N 4100 Rd E
- 10197 N 3500 Rd E
- 408 S Walnut St
- 103 S Walnut St
- 104 S Main St
- 126 Maple St
- 324 S State St
- Lot 6 Falcon Dr
- Lot 7 Falcon Dr
- Lot 5 Falcon Dr
- Lot 4 Falcon Dr
- Lot 3 Falcon Dr
- Lot 1 Falcon Dr
- 704 Falcon Dr
- 604 Hazel Dr
- 509 S Lawrence St
- 415 E 14th St