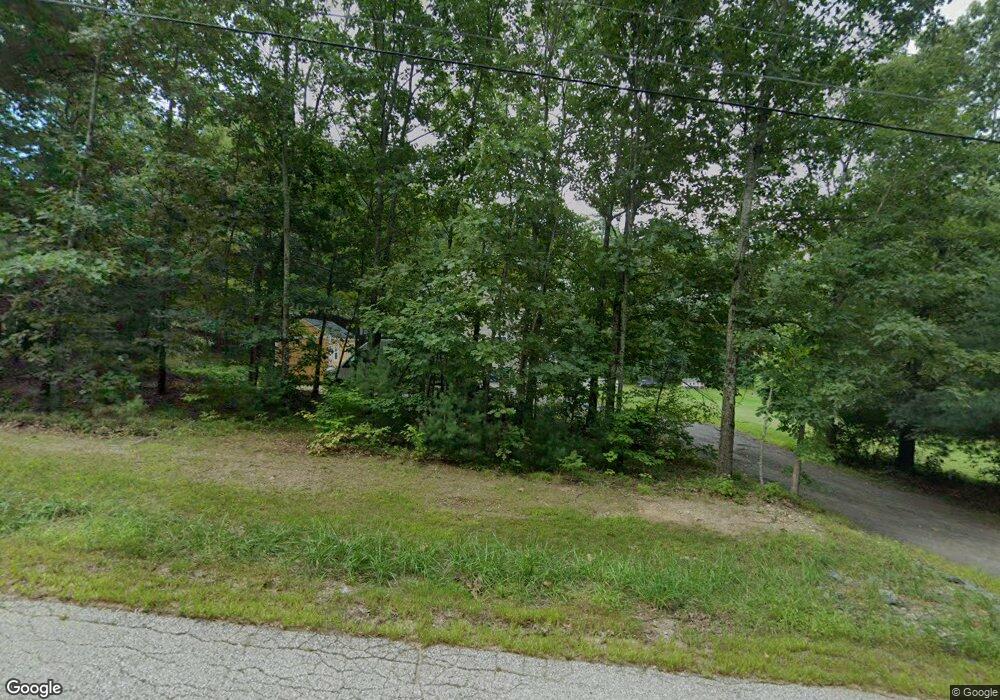
15 Pond Ln Fremont, NH 03044
Estimated Value: $453,000 - $540,260
3
Beds
2
Baths
1,428
Sq Ft
$355/Sq Ft
Est. Value
About This Home
This home is located at 15 Pond Ln, Fremont, NH 03044 and is currently estimated at $506,315, approximately $354 per square foot. 15 Pond Ln is a home located in Rockingham County with nearby schools including Ellis School.
Ownership History
Date
Name
Owned For
Owner Type
Purchase Details
Closed on
Dec 19, 2023
Sold by
Therrien Ellen M and Therrien Daniel T
Bought by
Therrien
Current Estimated Value
Purchase Details
Closed on
Mar 24, 2011
Sold by
Hsbc Mortgage Svcs Inc
Bought by
Therrien Ellen M and Therrien Daniel T
Home Financials for this Owner
Home Financials are based on the most recent Mortgage that was taken out on this home.
Original Mortgage
$182,161
Interest Rate
5.07%
Mortgage Type
Purchase Money Mortgage
Purchase Details
Closed on
Sep 17, 2010
Sold by
Howard Charles M and Hsbc Mortgage Svcs Inc
Bought by
Hsbc Mortgage Svcs Inc
Purchase Details
Closed on
Aug 29, 2003
Sold by
Falcone Martin M and Falcone Suzie
Bought by
Howard Charles M
Home Financials for this Owner
Home Financials are based on the most recent Mortgage that was taken out on this home.
Original Mortgage
$249,900
Interest Rate
5.69%
Mortgage Type
Purchase Money Mortgage
Create a Home Valuation Report for This Property
The Home Valuation Report is an in-depth analysis detailing your home's value as well as a comparison with similar homes in the area
Home Values in the Area
Average Home Value in this Area
Purchase History
| Date | Buyer | Sale Price | Title Company |
|---|---|---|---|
| Therrien | -- | None Available | |
| Therrien Ellen M | $186,900 | -- | |
| Hsbc Mortgage Svcs Inc | $187,100 | -- | |
| Howard Charles M | $249,900 | -- |
Source: Public Records
Mortgage History
| Date | Status | Borrower | Loan Amount |
|---|---|---|---|
| Previous Owner | Howard Charles M | $180,415 | |
| Previous Owner | Howard Charles M | $182,161 | |
| Previous Owner | Howard Charles M | $249,900 |
Source: Public Records
Tax History Compared to Growth
Tax History
| Year | Tax Paid | Tax Assessment Tax Assessment Total Assessment is a certain percentage of the fair market value that is determined by local assessors to be the total taxable value of land and additions on the property. | Land | Improvement |
|---|---|---|---|---|
| 2024 | $7,563 | $286,800 | $123,200 | $163,600 |
| 2023 | $6,766 | $286,800 | $123,200 | $163,600 |
| 2022 | $6,651 | $286,800 | $123,200 | $163,600 |
| 2021 | $6,401 | $286,800 | $123,200 | $163,600 |
| 2020 | $6,580 | $284,500 | $123,200 | $161,300 |
| 2019 | $6,579 | $211,900 | $87,900 | $124,000 |
| 2018 | $6,230 | $211,900 | $87,900 | $124,000 |
| 2017 | $6,185 | $211,900 | $87,900 | $124,000 |
| 2016 | $6,332 | $211,900 | $87,900 | $124,000 |
| 2015 | $6,145 | $211,900 | $87,900 | $124,000 |
| 2014 | $6,335 | $224,500 | $87,900 | $136,600 |
| 2013 | $6,400 | $224,500 | $87,900 | $136,600 |
Source: Public Records
Map
Nearby Homes