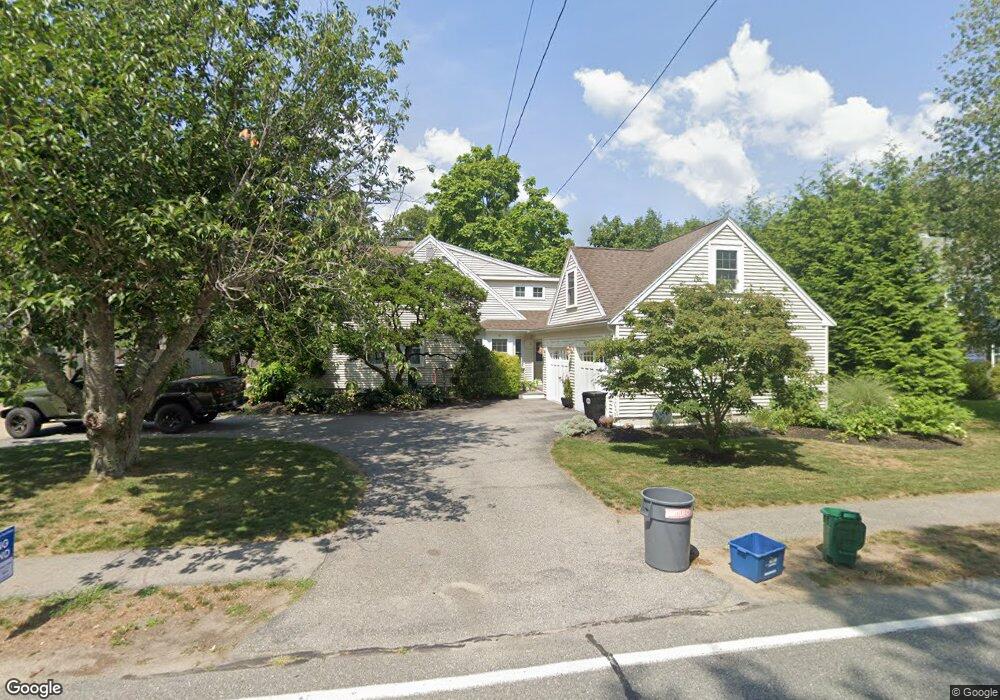
15 Porter St Wenham, MA 01984
Estimated Value: $994,000 - $1,385,000
4
Beds
2
Baths
4,192
Sq Ft
$289/Sq Ft
Est. Value
About This Home
This home is located at 15 Porter St, Wenham, MA 01984 and is currently estimated at $1,211,373, approximately $288 per square foot. 15 Porter St is a home located in Essex County with nearby schools including Winthrop School, Bessie Buker Elementary School, and Cutler Elementary School.
Ownership History
Date
Name
Owned For
Owner Type
Purchase Details
Closed on
Oct 27, 2021
Sold by
Desimone Amy L and Desimone John F
Bought by
15 Porter Street Rt and Desimone
Current Estimated Value
Purchase Details
Closed on
Mar 7, 2013
Sold by
Desimone Amy L
Bought by
Desimone Amy L and Desimone John F
Home Financials for this Owner
Home Financials are based on the most recent Mortgage that was taken out on this home.
Original Mortgage
$374,897
Interest Rate
3.45%
Mortgage Type
New Conventional
Purchase Details
Closed on
May 24, 2002
Sold by
Madden Pauline M Est and Grace Nicholas A
Bought by
Desimone Amy L and Desimone John F
Create a Home Valuation Report for This Property
The Home Valuation Report is an in-depth analysis detailing your home's value as well as a comparison with similar homes in the area
Home Values in the Area
Average Home Value in this Area
Purchase History
| Date | Buyer | Sale Price | Title Company |
|---|---|---|---|
| 15 Porter Street Rt | -- | None Available | |
| 15 Porter Street Rt | -- | None Available | |
| Desimone Amy L | -- | -- | |
| Desimone Amy L | -- | -- | |
| Desimone Amy L | $418,000 | -- | |
| Desimone Amy L | $418,000 | -- |
Source: Public Records
Mortgage History
| Date | Status | Borrower | Loan Amount |
|---|---|---|---|
| Previous Owner | Desimone Amy L | $374,897 |
Source: Public Records
Tax History Compared to Growth
Tax History
| Year | Tax Paid | Tax Assessment Tax Assessment Total Assessment is a certain percentage of the fair market value that is determined by local assessors to be the total taxable value of land and additions on the property. | Land | Improvement |
|---|---|---|---|---|
| 2025 | $14,735 | $948,200 | $481,000 | $467,200 |
| 2024 | $14,374 | $917,900 | $481,000 | $436,900 |
| 2023 | $14,244 | $821,000 | $516,000 | $305,000 |
| 2022 | $14,489 | $740,000 | $434,200 | $305,800 |
| 2021 | $13,908 | $706,700 | $400,900 | $305,800 |
| 2020 | $12,669 | $668,900 | $399,400 | $269,500 |
| 2019 | $12,054 | $668,900 | $399,400 | $269,500 |
| 2018 | $11,120 | $591,800 | $386,600 | $205,200 |
| 2017 | $10,848 | $591,800 | $386,600 | $205,200 |
| 2016 | $10,049 | $591,800 | $386,600 | $205,200 |
| 2015 | $9,617 | $591,800 | $386,600 | $205,200 |
Source: Public Records
Map
Nearby Homes