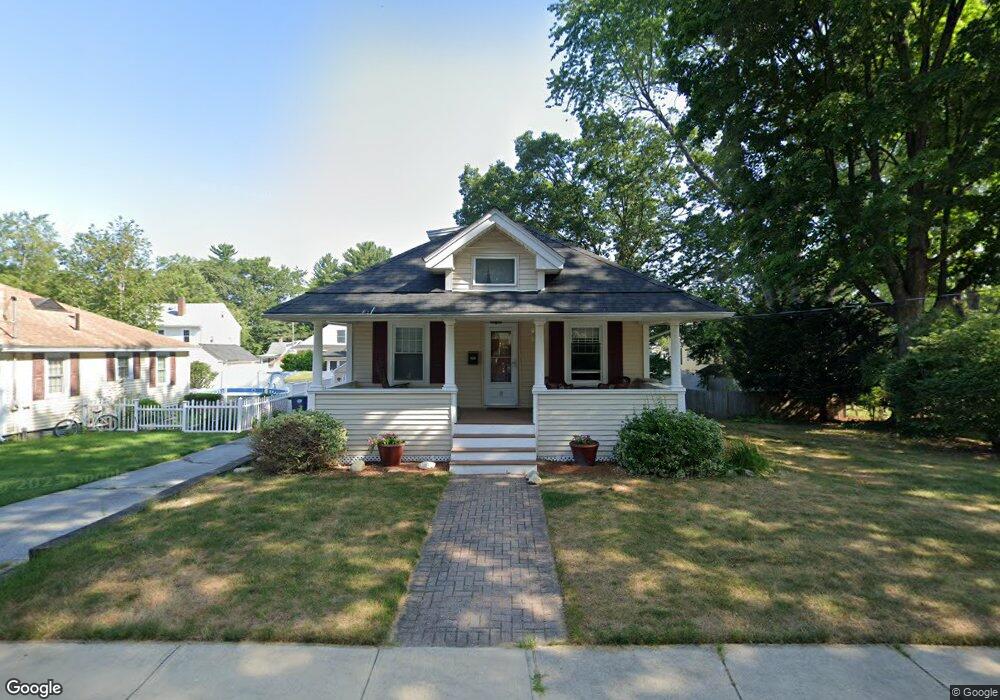
15 Pratt St Unit 39 Nashua, NH 03060
South End Nashua NeighborhoodEstimated Value: $448,871 - $473,000
2
Beds
1
Bath
1,209
Sq Ft
$383/Sq Ft
Est. Value
About This Home
This home is located at 15 Pratt St Unit 39, Nashua, NH 03060 and is currently estimated at $462,718, approximately $382 per square foot. 15 Pratt St Unit 39 is a home located in Hillsborough County with nearby schools including Sunset Heights Elementary School, Elm Street Middle School, and Nashua High School North.
Ownership History
Date
Name
Owned For
Owner Type
Purchase Details
Closed on
Nov 6, 2025
Sold by
Brunetto Patricia G
Bought by
Patricia G Brunetto Ret and Brunetto
Current Estimated Value
Purchase Details
Closed on
Aug 31, 2007
Sold by
Richardson Kevin and Richardson Neala
Bought by
Brunetto Patricia G
Home Financials for this Owner
Home Financials are based on the most recent Mortgage that was taken out on this home.
Original Mortgage
$182,000
Interest Rate
6.71%
Mortgage Type
Purchase Money Mortgage
Purchase Details
Closed on
Jun 13, 2003
Sold by
Laverty Debra J
Bought by
Richardson Kevin and Richardson Neala
Purchase Details
Closed on
May 8, 1996
Sold by
Fhlmc
Bought by
Laverty Debra J
Create a Home Valuation Report for This Property
The Home Valuation Report is an in-depth analysis detailing your home's value as well as a comparison with similar homes in the area
Home Values in the Area
Average Home Value in this Area
Purchase History
| Date | Buyer | Sale Price | Title Company |
|---|---|---|---|
| Patricia G Brunetto Ret | -- | -- | |
| Brunetto Patricia G | $240,000 | -- | |
| Richardson Kevin | $204,900 | -- | |
| Laverty Debra J | $34,500 | -- |
Source: Public Records
Mortgage History
| Date | Status | Borrower | Loan Amount |
|---|---|---|---|
| Previous Owner | Laverty Debra J | $181,000 | |
| Previous Owner | Laverty Debra J | $182,000 | |
| Previous Owner | Laverty Debra J | $202,400 | |
| Previous Owner | Laverty Debra J | $25,300 |
Source: Public Records
Tax History Compared to Growth
Tax History
| Year | Tax Paid | Tax Assessment Tax Assessment Total Assessment is a certain percentage of the fair market value that is determined by local assessors to be the total taxable value of land and additions on the property. | Land | Improvement |
|---|---|---|---|---|
| 2024 | $5,843 | $367,500 | $154,100 | $213,400 |
| 2023 | $5,824 | $319,500 | $123,300 | $196,200 |
| 2022 | $5,773 | $319,500 | $123,300 | $196,200 |
| 2021 | $4,823 | $207,700 | $82,200 | $125,500 |
| 2020 | $6,972 | $206,900 | $82,200 | $124,700 |
| 2019 | $4,502 | $206,900 | $82,200 | $124,700 |
| 2018 | $4,388 | $206,900 | $82,200 | $124,700 |
| 2017 | $3,840 | $148,900 | $82,200 | $66,700 |
| 2016 | $3,733 | $148,900 | $82,200 | $66,700 |
| 2015 | $3,653 | $148,900 | $82,200 | $66,700 |
| 2014 | $3,581 | $148,900 | $82,200 | $66,700 |
Source: Public Records
Map
Nearby Homes
- 1 Circle Ave
- 15 Lovell St Unit 3
- 15 Lovell St Unit 10
- 27 Fifield St Unit 13
- 6 Hayden St
- 2 Lyons St
- 63 Dexter St
- 36 Eastman St Unit 26
- 24 E Otterson St
- 15 Learned St Unit 123
- 97 Linwood St
- 65 Allds St
- 8 Buck St Unit 10
- 5 Mulberry St
- 17 Herrick St
- 22 Wilder St
- 4 Badger St
- 13 Mulvanity St
- 30 Ledge St
- 38 Central St