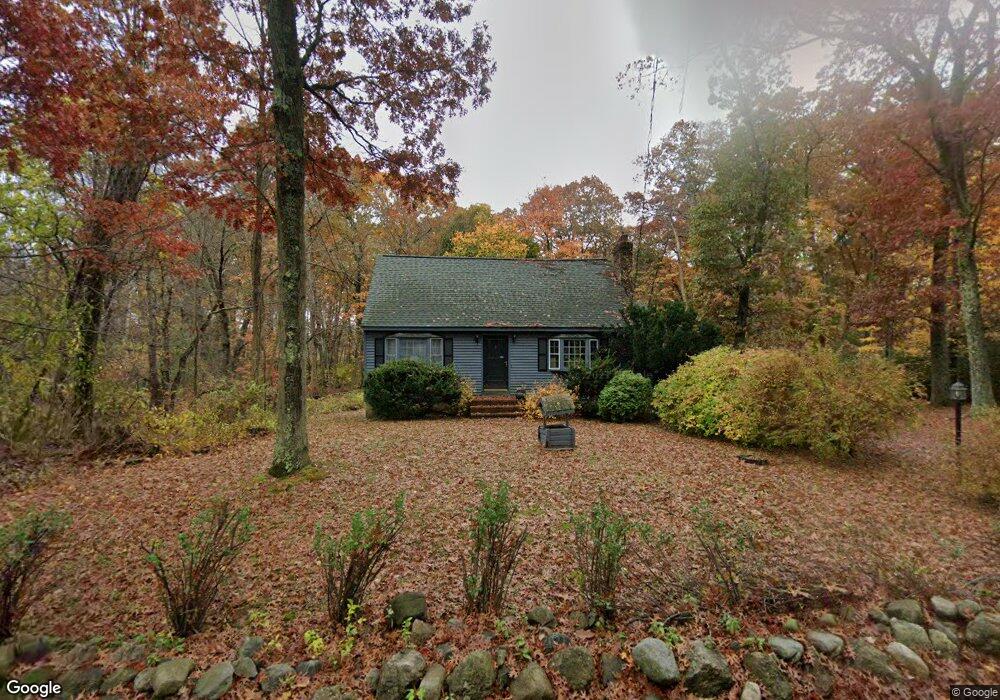
15 Prospect Rd Andover, MA 01810
Phillips Academy NeighborhoodEstimated Value: $710,000 - $848,000
3
Beds
2
Baths
1,428
Sq Ft
$547/Sq Ft
Est. Value
About This Home
This home is located at 15 Prospect Rd, Andover, MA 01810 and is currently estimated at $780,957, approximately $546 per square foot. 15 Prospect Rd is a home located in Essex County with nearby schools including Bancroft Elementary School, Doherty Middle School, and Andover High School.
Ownership History
Date
Name
Owned For
Owner Type
Purchase Details
Closed on
Jun 14, 2007
Sold by
Morrison Sandra B
Bought by
Morrison Rt and Morrison Sandra B
Current Estimated Value
Create a Home Valuation Report for This Property
The Home Valuation Report is an in-depth analysis detailing your home's value as well as a comparison with similar homes in the area
Home Values in the Area
Average Home Value in this Area
Purchase History
| Date | Buyer | Sale Price | Title Company |
|---|---|---|---|
| Morrison Rt | -- | -- |
Source: Public Records
Tax History Compared to Growth
Tax History
| Year | Tax Paid | Tax Assessment Tax Assessment Total Assessment is a certain percentage of the fair market value that is determined by local assessors to be the total taxable value of land and additions on the property. | Land | Improvement |
|---|---|---|---|---|
| 2024 | $9,087 | $705,500 | $457,200 | $248,300 |
| 2023 | $8,682 | $635,600 | $412,300 | $223,300 |
| 2022 | $8,306 | $568,900 | $365,700 | $203,200 |
| 2021 | $7,936 | $519,000 | $333,000 | $186,000 |
| 2020 | $7,610 | $507,000 | $325,200 | $181,800 |
| 2019 | $7,388 | $483,800 | $306,900 | $176,900 |
| 2018 | $7,069 | $452,000 | $289,900 | $162,100 |
| 2017 | $6,752 | $444,800 | $284,200 | $160,600 |
| 2016 | $6,328 | $427,000 | $266,400 | $160,600 |
| 2015 | $6,099 | $407,400 | $256,400 | $151,000 |
Source: Public Records
Map
Nearby Homes