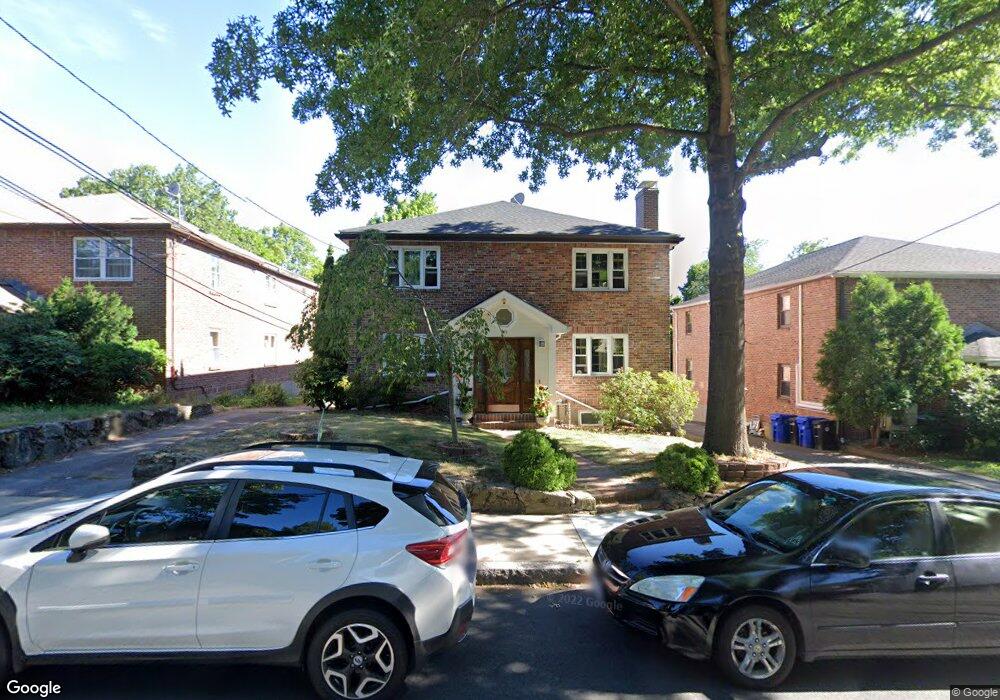
15 Reservoir Rd Chestnut Hill, MA 02467
Chestnut Hill NeighborhoodEstimated Value: $2,012,000 - $2,622,270
6
Beds
5
Baths
3,216
Sq Ft
$702/Sq Ft
Est. Value
About This Home
This home is located at 15 Reservoir Rd, Chestnut Hill, MA 02467 and is currently estimated at $2,258,568, approximately $702 per square foot. 15 Reservoir Rd is a home located in Norfolk County with nearby schools including Heath Elementary School, Maimonides School, and Mount Alvernia Academy.
Ownership History
Date
Name
Owned For
Owner Type
Purchase Details
Closed on
Nov 11, 2025
Sold by
Wong Stanley and Wong Evelyn L
Bought by
Wong
Current Estimated Value
Purchase Details
Closed on
Mar 31, 2014
Sold by
Wong Stanley
Bought by
Wong Stanley and Wong Evelyn L
Home Financials for this Owner
Home Financials are based on the most recent Mortgage that was taken out on this home.
Original Mortgage
$470,000
Interest Rate
4.27%
Mortgage Type
New Conventional
Purchase Details
Closed on
Dec 31, 2010
Sold by
Wong Stanley and Wong Evelyn
Bought by
Wong Stanley
Home Financials for this Owner
Home Financials are based on the most recent Mortgage that was taken out on this home.
Original Mortgage
$533,000
Interest Rate
4.37%
Mortgage Type
Purchase Money Mortgage
Purchase Details
Closed on
Mar 27, 1998
Sold by
Potts J Brian
Bought by
Wong Evelyn and Wong Stanley
Purchase Details
Closed on
Feb 19, 1988
Sold by
Laugharn James
Bought by
Potts J Brian
Create a Home Valuation Report for This Property
The Home Valuation Report is an in-depth analysis detailing your home's value as well as a comparison with similar homes in the area
Home Values in the Area
Average Home Value in this Area
Purchase History
| Date | Buyer | Sale Price | Title Company |
|---|---|---|---|
| Wong | -- | -- | |
| Wong Stanley | -- | -- | |
| Wong Stanley | -- | -- | |
| Wong Evelyn | $535,000 | -- | |
| Wong Evelyn | $535,000 | -- | |
| Potts J Brian | $35,000 | -- |
Source: Public Records
Mortgage History
| Date | Status | Borrower | Loan Amount |
|---|---|---|---|
| Previous Owner | Wong Stanley | $470,000 | |
| Previous Owner | Wong Stanley | $533,000 | |
| Previous Owner | Potts J Brian | $310,000 |
Source: Public Records
Tax History Compared to Growth
Tax History
| Year | Tax Paid | Tax Assessment Tax Assessment Total Assessment is a certain percentage of the fair market value that is determined by local assessors to be the total taxable value of land and additions on the property. | Land | Improvement |
|---|---|---|---|---|
| 2025 | $19,849 | $2,011,000 | $924,000 | $1,087,000 |
| 2024 | $19,609 | $2,007,100 | $888,500 | $1,118,600 |
| 2023 | $19,442 | $1,950,000 | $811,300 | $1,138,700 |
| 2022 | $18,924 | $1,857,100 | $772,600 | $1,084,500 |
| 2021 | $17,500 | $1,785,700 | $742,900 | $1,042,800 |
| 2020 | $16,593 | $1,755,900 | $675,400 | $1,080,500 |
| 2019 | $15,669 | $1,672,200 | $643,200 | $1,029,000 |
| 2018 | $15,406 | $1,628,500 | $650,500 | $978,000 |
| 2017 | $14,898 | $1,507,900 | $613,700 | $894,200 |
| 2016 | $14,284 | $1,370,800 | $573,500 | $797,300 |
| 2015 | $13,046 | $1,221,500 | $536,000 | $685,500 |
| 2014 | $12,686 | $1,113,800 | $487,000 | $626,800 |
Source: Public Records
Map
Nearby Homes
- 675 Chestnut Hill Ave
- 88 Cutler Ln
- 39 Clyde St
- 30 Ackers Ave
- 55 Leicester St
- 130 Cabot St
- 120 Seaver St Unit A103
- 120 Seaver St Unit C-102
- 80 Dudley St
- 540 Chestnut Hill Ave
- 71 Sears Rd
- 1014 Boylston St
- 142 Crafts Rd
- 382 Lee St
- 487 Boylston St Unit 3
- 371 Walnut St
- 8 Strathmore Rd Unit G
- 174 Middlesex Rd
- 17 Strathmore Rd Unit 2
- 94 Beaconsfield Rd Unit 201
- 15 Reservoir Rd Unit 1
- 19 Reservoir Rd
- 9 Reservoir Rd
- 9 Reservoir Rd
- 9 Reservoir Rd Unit 1
- 9 Reservoir Rd Unit 2
- 20 Reservoir Rd
- 45 Heath St
- 39 Heath St Unit 2
- 39 Heath St Unit 1
- 752 Boylston St
- 752 Boylston St Unit 1
- 752 Boylston St Unit 2
- 35 Heath St
- 33 Cutler Ln
- 748 Boylston St Unit 2
- 748 Boylston St Unit 1
- 744 Boylston St Unit 2
- 744 Boylston St
- 744 Boylston St Unit 1