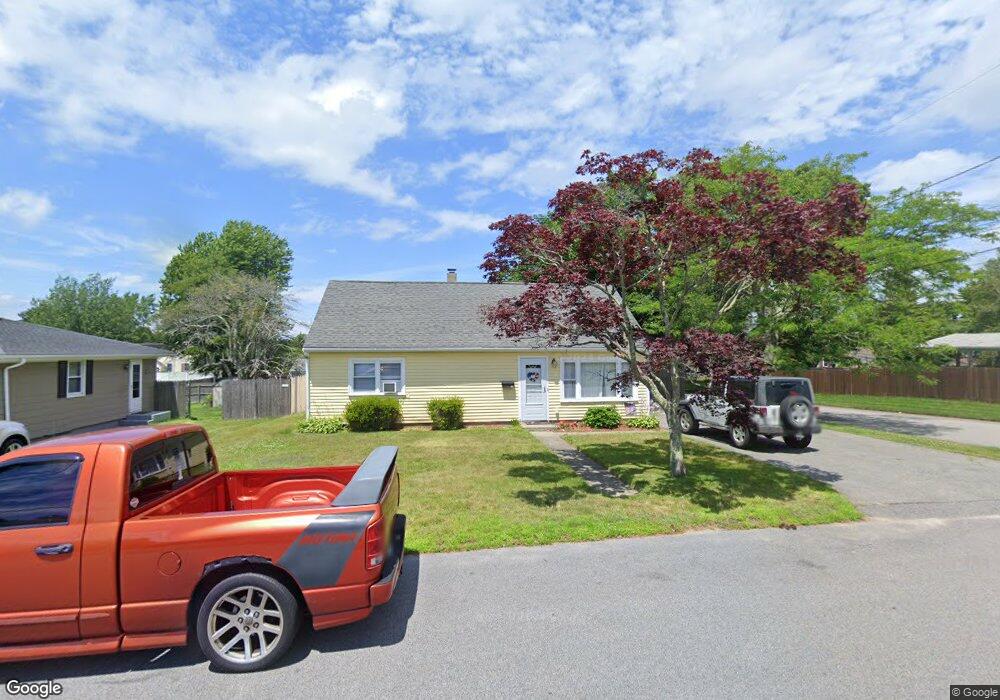
15 Robin Dr Bristol, RI 02809
The Narrows NeighborhoodEstimated Value: $449,596 - $511,000
3
Beds
1
Bath
1,296
Sq Ft
$371/Sq Ft
Est. Value
About This Home
This home is located at 15 Robin Dr, Bristol, RI 02809 and is currently estimated at $480,399, approximately $370 per square foot. 15 Robin Dr is a home located in Bristol County with nearby schools including Mt. Hope High School, Highlander Charter Middle and High School, and Our Lady of Mt. Carmel School.
Ownership History
Date
Name
Owned For
Owner Type
Purchase Details
Closed on
Aug 15, 2008
Sold by
Pacheco Joe M
Bought by
Mckenney Kelly N
Current Estimated Value
Home Financials for this Owner
Home Financials are based on the most recent Mortgage that was taken out on this home.
Original Mortgage
$221,067
Interest Rate
6.4%
Mortgage Type
Purchase Money Mortgage
Purchase Details
Closed on
Mar 11, 1998
Sold by
Scallin Andrew J
Bought by
Pacheco Joe M
Purchase Details
Closed on
Jul 27, 1993
Sold by
Vollaro Kenneth
Bought by
Scallin Andrew J
Create a Home Valuation Report for This Property
The Home Valuation Report is an in-depth analysis detailing your home's value as well as a comparison with similar homes in the area
Home Values in the Area
Average Home Value in this Area
Purchase History
| Date | Buyer | Sale Price | Title Company |
|---|---|---|---|
| Mckenney Kelly N | $242,000 | -- | |
| Pacheco Joe M | $90,000 | -- | |
| Scallin Andrew J | $91,000 | -- |
Source: Public Records
Mortgage History
| Date | Status | Borrower | Loan Amount |
|---|---|---|---|
| Open | Scallin Andrew J | $217,925 | |
| Closed | Scallin Andrew J | $223,730 | |
| Closed | Scallin Andrew J | $221,067 | |
| Previous Owner | Scallin Andrew J | $68,500 |
Source: Public Records
Tax History
| Year | Tax Paid | Tax Assessment Tax Assessment Total Assessment is a certain percentage of the fair market value that is determined by local assessors to be the total taxable value of land and additions on the property. | Land | Improvement |
|---|---|---|---|---|
| 2025 | $4,156 | $300,700 | $132,500 | $168,200 |
| 2024 | $4,156 | $300,700 | $132,500 | $168,200 |
| 2023 | $4,017 | $300,700 | $132,500 | $168,200 |
| 2022 | $3,909 | $300,700 | $132,500 | $168,200 |
| 2021 | $3,769 | $262,100 | $122,000 | $140,100 |
| 2020 | $3,688 | $262,100 | $122,000 | $140,100 |
| 2019 | $3,596 | $262,100 | $122,000 | $140,100 |
| 2018 | $3,648 | $237,200 | $116,500 | $120,700 |
| 2017 | $3,036 | $203,500 | $100,900 | $102,600 |
| 2016 | $3,006 | $203,500 | $100,900 | $102,600 |
| 2015 | $2,855 | $203,500 | $100,900 | $102,600 |
| 2014 | $2,790 | $213,610 | $101,600 | $112,010 |
Source: Public Records
Map
Nearby Homes
- 30 Sowams Dr
- 556 Metacom Ave
- 26 Roosevelt Dr
- 11 Gladding St
- 79 Hopeworth Ave
- 64 King Philip Ave
- 667 Metacom Ave Unit 14
- 669 Metacom Ave Unit 25
- 3 Knowlton Ct
- 7 Knowlton Ct
- 5 Knowlton Ct
- 25 Massasoit Ave
- 27 Massasoit Ave
- 85 Bay View Ave Unit 2
- 22 Harrison St
- 32 Massasoit Ave
- 30 Massasoit Ave
- 1 Knowlton Ct
- 2 Chilton St
- 3 Betsy Dr
Your Personal Tour Guide
Ask me questions while you tour the home.