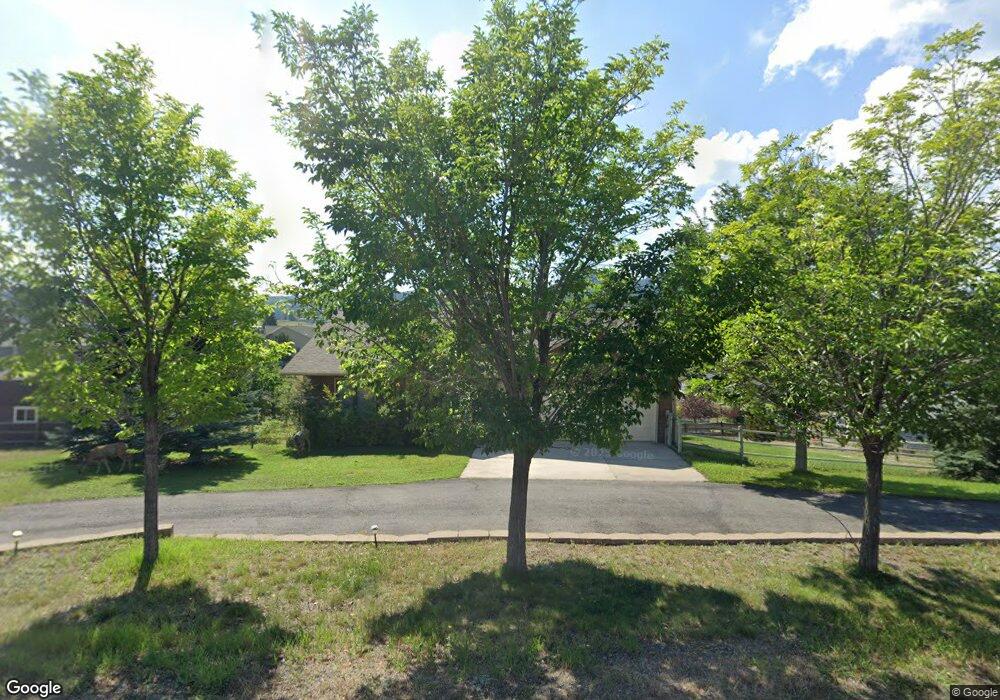
15 Ruby Mountain Rd Clancy, MT 59634
Montana City NeighborhoodEstimated Value: $629,000 - $691,000
4
Beds
3
Baths
1,348
Sq Ft
$480/Sq Ft
Est. Value
About This Home
This home is located at 15 Ruby Mountain Rd, Clancy, MT 59634 and is currently estimated at $647,002, approximately $479 per square foot. 15 Ruby Mountain Rd is a home located in Jefferson County with nearby schools including Montana City Elementary School, Montana City Middle School, and Jefferson High School.
Ownership History
Date
Name
Owned For
Owner Type
Purchase Details
Closed on
Apr 30, 2012
Sold by
Smith Mark S
Bought by
Stilson Diane D
Current Estimated Value
Home Financials for this Owner
Home Financials are based on the most recent Mortgage that was taken out on this home.
Original Mortgage
$250,000
Outstanding Balance
$173,861
Interest Rate
3.98%
Mortgage Type
VA
Estimated Equity
$473,141
Purchase Details
Closed on
Dec 3, 2010
Sold by
Seipp Michael and Seipp Glenda
Bought by
Smith Mark S
Home Financials for this Owner
Home Financials are based on the most recent Mortgage that was taken out on this home.
Original Mortgage
$278,630
Interest Rate
4.5%
Mortgage Type
FHA
Purchase Details
Closed on
Jul 21, 2008
Sold by
Burch Theodore G and Burch Alison L
Bought by
Meidinger Gary L and Meidinger Catherine L
Purchase Details
Closed on
Jun 11, 2007
Sold by
Quande Bruce H and Quande Susan J
Bought by
Maki Greg G
Create a Home Valuation Report for This Property
The Home Valuation Report is an in-depth analysis detailing your home's value as well as a comparison with similar homes in the area
Home Values in the Area
Average Home Value in this Area
Purchase History
| Date | Buyer | Sale Price | Title Company |
|---|---|---|---|
| Stilson Diane D | -- | Rocky Mountain Title & Insur | |
| Smith Mark S | -- | Surety Title Llc Dba Stewart | |
| Meidinger Gary L | -- | Rocky Mountain Title & Insur | |
| Maki Greg G | -- | Rocky Mountain Title & Insur |
Source: Public Records
Mortgage History
| Date | Status | Borrower | Loan Amount |
|---|---|---|---|
| Open | Stilson Diane D | $250,000 | |
| Previous Owner | Smith Mark S | $278,630 |
Source: Public Records
Tax History
| Year | Tax Paid | Tax Assessment Tax Assessment Total Assessment is a certain percentage of the fair market value that is determined by local assessors to be the total taxable value of land and additions on the property. | Land | Improvement |
|---|---|---|---|---|
| 2025 | $3,786 | $636,100 | $0 | $0 |
| 2024 | $4,380 | $534,900 | $0 | $0 |
| 2023 | $4,302 | $534,900 | $0 | $0 |
| 2022 | $3,753 | $366,300 | $0 | $0 |
| 2021 | $3,065 | $366,300 | $0 | $0 |
| 2020 | $3,569 | $341,800 | $0 | $0 |
| 2019 | $3,575 | $341,800 | $0 | $0 |
| 2018 | $3,408 | $307,500 | $0 | $0 |
| 2017 | $2,587 | $307,500 | $0 | $0 |
| 2016 | $3,137 | $292,700 | $0 | $0 |
| 2015 | $2,637 | $292,700 | $0 | $0 |
| 2014 | $2,272 | $146,386 | $0 | $0 |
Source: Public Records
Map
Nearby Homes
- 5 Crazy Mountain Rd
- 5 Crazy Mountain Cul de Sac
- 21 Mission Mountain Rd
- 10 Evening Star Dr
- 16 Evergreen Ct
- 26 Stoney Brook Dr Unit B
- 26 Stoney Brook Dr Unit D
- 26 Stoney Brook Dr Unit A
- 26 Stoney Brook Dr Unit C
- 39 Stoney Brook Dr Unit B
- 39 Stoney Brook Dr Unit A
- 39 Stoney Brook Dr Unit B
- 31 Stoney Brook Dr Unit B
- 23 B Stoney Brook Dr Unit B
- 23 B Stoney Brook Dr Unit A
- 36 Lost Trail
- 1196 Highway 282
- 9 Hilltop Dr
- 15 Hilltop Dr
- 10 Raven Ridge Rd
- 15 Ruby Mountain Rd
- 14 Shingle Butte Rd
- 18 Ruby Mountain Rd
- 16 Ruby Mountain Rd
- 22 Ruby Mountain Rd
- 9 Ruby Mountain Rd
- 10 Ruby Mountain Rd
- 15 Shingle Butte Rd
- 3 Monarch Ct
- 20 Shingle Butte Rd
- 9 Shingle Butte Rd
- 1 Monarch Ct
- 8 Ruby Mountain Rd
- 2 Shingle Butte Rd
- 5 Monarch Ct
- 19 Shingle Butte Rd
- 1 Ruby Mountain Rd
- 29 Ruby Mountain Rd
- 24 Shingle Butte Rd
- 25 Sandy Ln
Your Personal Tour Guide
Ask me questions while you tour the home.