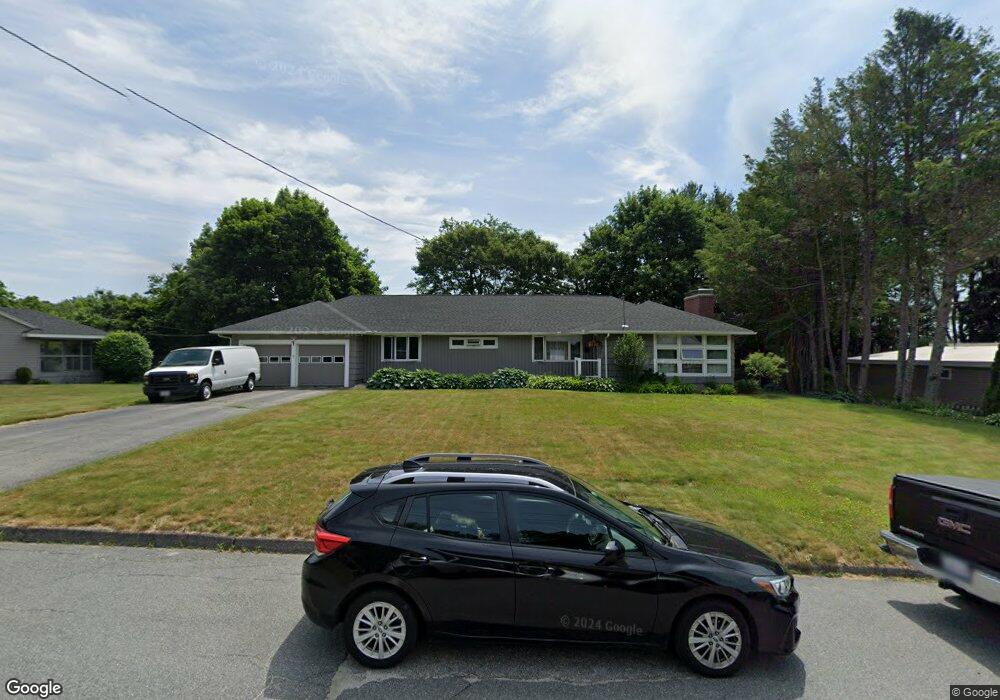
15 Rustic Dr Worcester, MA 01609
West Tatnuck NeighborhoodEstimated Value: $516,342 - $609,000
3
Beds
2
Baths
1,812
Sq Ft
$307/Sq Ft
Est. Value
About This Home
This home is located at 15 Rustic Dr, Worcester, MA 01609 and is currently estimated at $557,086, approximately $307 per square foot. 15 Rustic Dr is a home located in Worcester County with nearby schools including Tatnuck Magnet School, Chandler Magnet, and Jacob Hiatt Magnet School.
Ownership History
Date
Name
Owned For
Owner Type
Purchase Details
Closed on
Oct 5, 2022
Sold by
Pierre Janet M
Bought by
Pierre Irt
Current Estimated Value
Purchase Details
Closed on
Jul 31, 1997
Sold by
Kotlyar Mark and Kotlyar Alla
Bought by
Courchaine Robert A and Courchaine Janet M
Create a Home Valuation Report for This Property
The Home Valuation Report is an in-depth analysis detailing your home's value as well as a comparison with similar homes in the area
Home Values in the Area
Average Home Value in this Area
Purchase History
| Date | Buyer | Sale Price | Title Company |
|---|---|---|---|
| Pierre Irt | -- | None Available | |
| Courchaine Robert A | $150,000 | -- |
Source: Public Records
Mortgage History
| Date | Status | Borrower | Loan Amount |
|---|---|---|---|
| Previous Owner | Courchaine Robert A | $185,000 | |
| Previous Owner | Courchaine Robert A | $165,000 | |
| Previous Owner | Courchaine Robert A | $142,800 |
Source: Public Records
Tax History
| Year | Tax Paid | Tax Assessment Tax Assessment Total Assessment is a certain percentage of the fair market value that is determined by local assessors to be the total taxable value of land and additions on the property. | Land | Improvement |
|---|---|---|---|---|
| 2025 | $6,143 | $465,700 | $119,100 | $346,600 |
| 2024 | $5,983 | $435,100 | $119,100 | $316,000 |
| 2023 | $5,822 | $406,000 | $103,600 | $302,400 |
| 2022 | $5,190 | $341,200 | $82,900 | $258,300 |
| 2021 | $5,420 | $332,900 | $66,300 | $266,600 |
| 2020 | $5,166 | $303,900 | $66,200 | $237,700 |
| 2019 | $4,858 | $269,900 | $59,800 | $210,100 |
| 2018 | $4,673 | $247,100 | $59,800 | $187,300 |
| 2017 | $4,747 | $247,000 | $59,800 | $187,200 |
| 2016 | $4,757 | $230,800 | $44,800 | $186,000 |
| 2015 | $4,632 | $230,800 | $44,800 | $186,000 |
| 2014 | $4,510 | $230,800 | $44,800 | $186,000 |
Source: Public Records
Map
Nearby Homes
- 118 Beaconsfield Rd
- 122 Copperfield Rd
- 23 Orrison St
- 163 Moreland St
- 73 Moore Ave
- 12 Cardinal Rd
- 44 Drexel St
- 23 Tiverton Pkwy
- 31 Lenox St
- 19 Kenilworth Rd
- 26 Westbrook Rd
- 15 Dennison Rd
- 437 Salisbury St
- 148A Tory Fort Ln
- 3 Westwood Dr
- 42 Ellis Dr
- 47R Yarnie Unit 3A
- 47R Yarnie Unit 1B
- 47R Yarnie Unit 2B
- 47R Yarnie Unit 4B
Your Personal Tour Guide
Ask me questions while you tour the home.