Estimated Value: $651,000 - $687,207
--
Bed
--
Bath
2,154
Sq Ft
$311/Sq Ft
Est. Value
About This Home
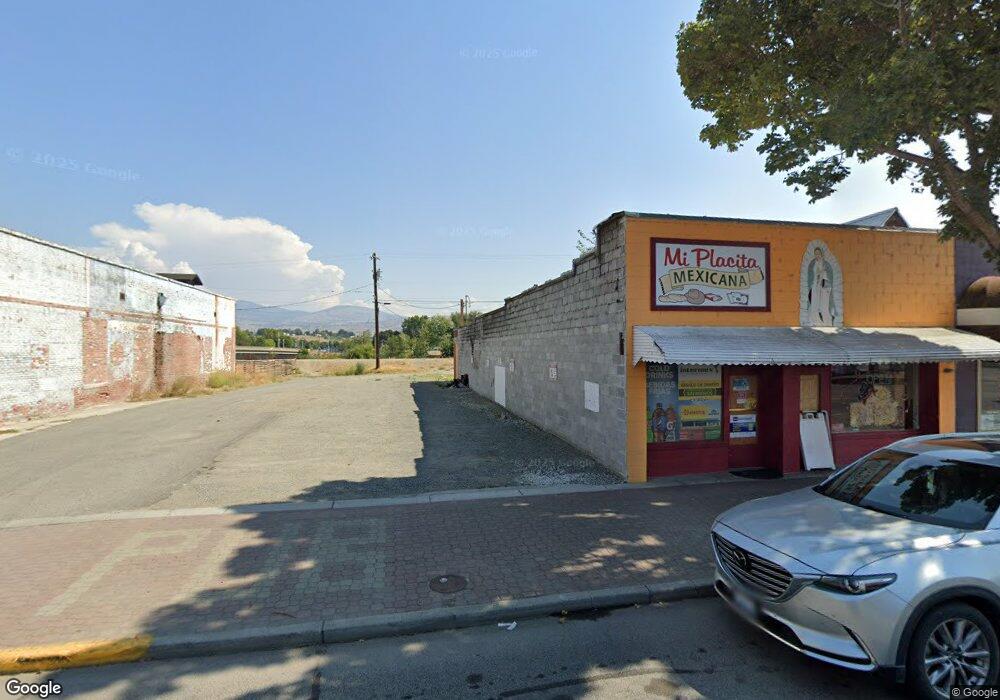
This home is located at 15 S Main St, Omak, WA 98841 and is currently estimated at $669,104, approximately $310 per square foot. 15 S Main St is a home located in Okanogan County with nearby schools including North Omak Elementary School, East Omak Elementary School, and Omak Middle School.
Ownership History
Date
Name
Owned For
Owner Type
Purchase Details
Closed on
Dec 29, 2017
Sold by
Berney Gery
Bought by
Delgado Veronica and Delgado Salvador
Current Estimated Value
Purchase Details
Closed on
May 27, 2005
Sold by
Davis Bill and Davis Barbara
Bought by
Molkjer Dennis and Molkjer Nina
Home Financials for this Owner
Home Financials are based on the most recent Mortgage that was taken out on this home.
Original Mortgage
$150,000
Interest Rate
5.74%
Mortgage Type
Commercial
Create a Home Valuation Report for This Property
The Home Valuation Report is an in-depth analysis detailing your home's value as well as a comparison with similar homes in the area
Home Values in the Area
Average Home Value in this Area
Purchase History
| Date | Buyer | Sale Price | Title Company |
|---|---|---|---|
| Delgado Veronica | $20,000 | None Available | |
| Molkjer Dennis | $199,673 | Transnation Title |
Source: Public Records
Mortgage History
| Date | Status | Borrower | Loan Amount |
|---|---|---|---|
| Previous Owner | Molkjer Dennis | $150,000 |
Source: Public Records
Tax History Compared to Growth
Tax History
| Year | Tax Paid | Tax Assessment Tax Assessment Total Assessment is a certain percentage of the fair market value that is determined by local assessors to be the total taxable value of land and additions on the property. | Land | Improvement |
|---|---|---|---|---|
| 2025 | $135 | $13,800 | $13,800 | -- |
| 2024 | $135 | $13,800 | $13,800 | -- |
| 2022 | $159 | $13,800 | $13,800 | $0 |
| 2021 | $170 | $13,800 | $13,800 | $0 |
| 2020 | $166 | $13,800 | $13,800 | $0 |
| 2019 | $158 | $13,800 | $13,800 | $0 |
| 2018 | $194 | $13,800 | $13,800 | $0 |
| 2017 | $2,381 | $13,800 | $13,800 | $0 |
| 2016 | $2,349 | $195,100 | $13,800 | $181,300 |
| 2015 | $2,310 | $200,000 | $13,800 | $186,200 |
| 2013 | -- | $200,000 | $13,800 | $186,200 |
Source: Public Records
Map
Nearby Homes
- 0 Asotin St S Unit NWM2460139
- 317 Ash St S
- 309 S Birch St
- 122 W 4th Ave W
- 18 Cherry Ave W
- 129 N Cedar St
- 12 Dewberry Ave W
- 215 E Dewberry Ave
- 28 Fir St N
- 430 W 4th Ave
- 519 Locust St
- 120 S Granite St
- 367 Fig Ave E
- 522 Locust St
- 132 Montvu Dr
- 14 Dalton Rd
- 319 Oak St
- 709 Sunrise Dr
- 14 Hahn Rd
- 644 E Dewberry Ave