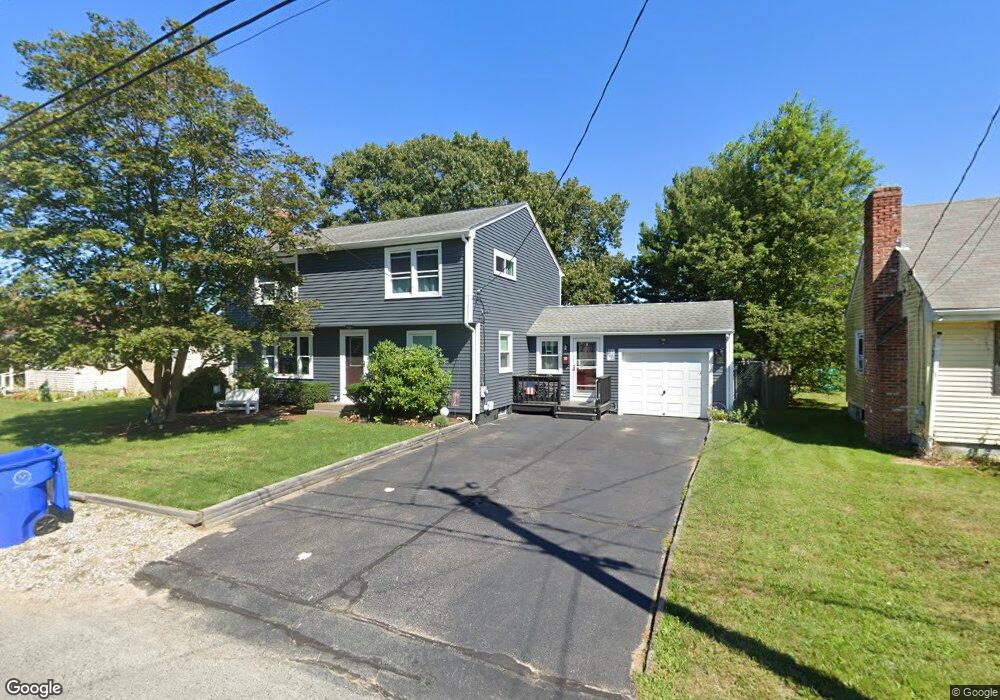
15 Sachem Rd Riverside, RI 02915
Riverside NeighborhoodEstimated Value: $417,000 - $666,000
4
Beds
2
Baths
1,956
Sq Ft
$269/Sq Ft
Est. Value
About This Home
This home is located at 15 Sachem Rd, Riverside, RI 02915 and is currently estimated at $526,446, approximately $269 per square foot. 15 Sachem Rd is a home located in Providence County with nearby schools including East Providence High School, St Luke Elementary School, and Barrington Christian Academy.
Ownership History
Date
Name
Owned For
Owner Type
Purchase Details
Closed on
Oct 4, 2024
Sold by
Eannarino Paul A and Eannarino Robyn
Bought by
Robyn Paul A and Robyn Eannarino
Current Estimated Value
Purchase Details
Closed on
Feb 12, 2013
Sold by
Eannarino Paul A
Bought by
Eannarino Paul A and Eannarino Robyn
Create a Home Valuation Report for This Property
The Home Valuation Report is an in-depth analysis detailing your home's value as well as a comparison with similar homes in the area
Home Values in the Area
Average Home Value in this Area
Purchase History
| Date | Buyer | Sale Price | Title Company |
|---|---|---|---|
| Robyn Paul A | -- | None Available | |
| Robyn Paul A | -- | None Available | |
| Eannarino Paul A | -- | -- | |
| Eannarino Paul A | -- | -- |
Source: Public Records
Mortgage History
| Date | Status | Borrower | Loan Amount |
|---|---|---|---|
| Previous Owner | Eannarino Paul A | $100,000 | |
| Previous Owner | Eannarino Paul A | $74,346 | |
| Previous Owner | Eannarino Paul A | $117,000 |
Source: Public Records
Tax History Compared to Growth
Tax History
| Year | Tax Paid | Tax Assessment Tax Assessment Total Assessment is a certain percentage of the fair market value that is determined by local assessors to be the total taxable value of land and additions on the property. | Land | Improvement |
|---|---|---|---|---|
| 2025 | $6,051 | $463,000 | $139,500 | $323,500 |
| 2024 | $5,427 | $354,000 | $116,200 | $237,800 |
| 2023 | $5,225 | $354,000 | $116,200 | $237,800 |
| 2022 | $5,008 | $229,100 | $61,300 | $167,800 |
| 2021 | $4,926 | $229,100 | $60,000 | $169,100 |
| 2020 | $4,717 | $229,100 | $60,000 | $169,100 |
| 2019 | $4,587 | $229,100 | $60,000 | $169,100 |
| 2018 | $5,111 | $223,400 | $58,400 | $165,000 |
| 2017 | $4,997 | $223,400 | $58,400 | $165,000 |
| 2016 | $4,973 | $223,400 | $58,400 | $165,000 |
| 2015 | $5,171 | $225,300 | $54,100 | $171,200 |
| 2014 | $5,171 | $225,300 | $54,100 | $171,200 |
Source: Public Records
Map
Nearby Homes
- 85 Hilton Ave
- 6 Hilton Ave
- 140 Promenade St
- 146 Becker Ave
- 45 Washington Rd
- 5 Booth Ave
- 81 Pine Crest Dr
- 83 Pine Crest Dr
- 25 Park Square Ave
- 27 Rosedale Ave
- 735 Willett Ave Unit 806
- 25 Winslow St
- 6 Hazelton Rd
- 46 Tanglewood Dr
- 4 Spinnaker Dr
- 16 Highview Ave
- 0 Carousel Dr
- 6 Kenmore Ct
- 29 Lake Ave
- 25 Woodbine St
- 17 Sachem Rd
- 11 Sachem Rd
- 14 Sachem Rd
- 18 Sachem Rd
- 1032 Willett Ave
- 22 Sachem Rd
- 1024 Willett Ave
- 1050 Willett Ave
- 26 Sachem Rd
- 108 Hilton Ave
- 102 Hilton Ave
- 110 Hilton Ave
- 100 Hilton Ave
- 96 Hilton Ave
- 92 Hilton Ave
- 30 Sachem Rd
- 1000 Willett Ave Unit 7
- 1000 Willett Ave
- 103 Hilton Ave
- 107 Hilton Ave