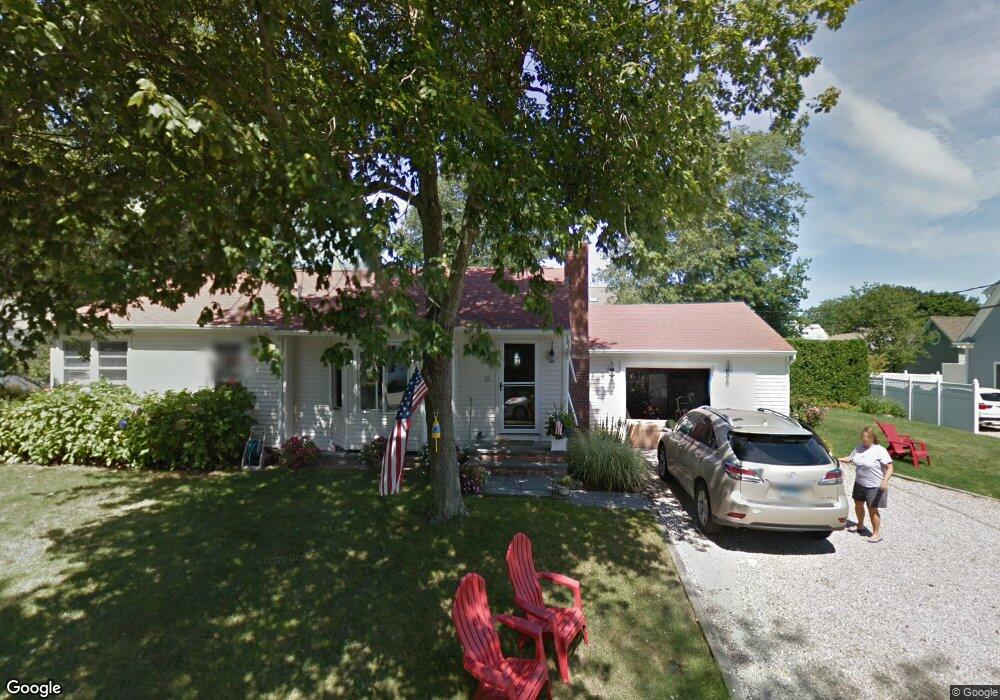
15 Sea View Ave Niantic, CT 06357
Estimated Value: $681,661 - $1,244,000
4
Beds
2
Baths
1,890
Sq Ft
$482/Sq Ft
Est. Value
About This Home
This home is located at 15 Sea View Ave, Niantic, CT 06357 and is currently estimated at $911,165, approximately $482 per square foot. 15 Sea View Ave is a home located in New London County with nearby schools including East Lyme Middle School, East Lyme High School, and The Light House Voc-Ed Center.
Ownership History
Date
Name
Owned For
Owner Type
Purchase Details
Closed on
Jun 7, 2010
Sold by
Delmastro Joanne E
Bought by
Meggers Thomas W and Murdock-Meggers Robin
Current Estimated Value
Home Financials for this Owner
Home Financials are based on the most recent Mortgage that was taken out on this home.
Original Mortgage
$320,000
Outstanding Balance
$107,729
Interest Rate
5.12%
Mortgage Type
Purchase Money Mortgage
Estimated Equity
$803,436
Purchase Details
Closed on
Apr 19, 2007
Sold by
Greeley Robert and Hall Susana
Bought by
Delmastro Joanne
Purchase Details
Closed on
Nov 13, 1998
Sold by
Fleming Ralph D and Fleming Helen W
Bought by
Greeley Robert J and Hall Susana L
Create a Home Valuation Report for This Property
The Home Valuation Report is an in-depth analysis detailing your home's value as well as a comparison with similar homes in the area
Home Values in the Area
Average Home Value in this Area
Purchase History
| Date | Buyer | Sale Price | Title Company |
|---|---|---|---|
| Meggers Thomas W | $565,000 | -- | |
| Delmastro Joanne | $410,000 | -- | |
| Greeley Robert J | $126,000 | -- | |
| Meggers Thomas W | $565,000 | -- | |
| Delmastro Joanne | $410,000 | -- | |
| Greeley Robert J | $126,000 | -- |
Source: Public Records
Mortgage History
| Date | Status | Borrower | Loan Amount |
|---|---|---|---|
| Open | Greeley Robert J | $320,000 | |
| Closed | Greeley Robert J | $320,000 | |
| Previous Owner | Greeley Robert J | $330,000 |
Source: Public Records
Tax History Compared to Growth
Tax History
| Year | Tax Paid | Tax Assessment Tax Assessment Total Assessment is a certain percentage of the fair market value that is determined by local assessors to be the total taxable value of land and additions on the property. | Land | Improvement |
|---|---|---|---|---|
| 2025 | $9,396 | $335,440 | $181,720 | $153,720 |
| 2024 | $8,839 | $335,440 | $181,720 | $153,720 |
| 2023 | $8,346 | $335,440 | $181,720 | $153,720 |
| 2022 | $7,997 | $335,440 | $181,720 | $153,720 |
| 2021 | $7,314 | $256,550 | $157,500 | $99,050 |
| 2020 | $7,276 | $256,550 | $157,500 | $99,050 |
| 2019 | $7,232 | $256,550 | $157,500 | $99,050 |
| 2018 | $7,017 | $256,550 | $157,500 | $99,050 |
| 2017 | $6,711 | $256,550 | $157,500 | $99,050 |
| 2016 | $6,439 | $253,890 | $157,500 | $96,390 |
| 2015 | $6,274 | $253,890 | $157,500 | $96,390 |
| 2014 | $6,101 | $253,890 | $157,500 | $96,390 |
Source: Public Records
Map
Nearby Homes
- 48 Billow Rd
- 11 Sunset Ave
- 43 Attawan Ave
- 5 Attawan Ave
- 46 Old Black Point Rd
- 127 Black Point Rd Unit 7
- 23 Central Ave
- 15 Griswold Rd
- 68-70 Black Point Rd
- 223 Giants Neck Rd
- 9 Columbus Ave
- 43 Village Crossing Unit 43
- 78 Corey Ln Unit 9
- 47 Village Crossing Unit 47
- 46 Village Crossing Unit 46
- 48 Village Crossing Unit 48
- 3 Pattagansett Ct
- 97 W Main St Unit 24
- 38 Hope St Unit 1307
- 37 Stoneywood Dr
- 13 Sea View Ave
- 17 Sea View Ave
- 12 Sea Breeze Ave
- 18 Sea Breeze Ave
- 11 Sea View Ave
- 16 Sea View Ave
- 19 Sea View Ave
- 18 Sea View Ave
- 14 Sea View Ave
- 10 Sea Breeze Ave
- 20 Sea Breeze Ave
- 7 Sea View Ave
- 20 Sea View Ave
- 8 Sea Breeze Ave
- 10 Sea View Ave
- 21 Sea View Ave
- 15 Sea Breeze Ave
- 19 Sea Crest Ave
- 13 Sea Breeze Ave
- 17 Sea Breeze Ave