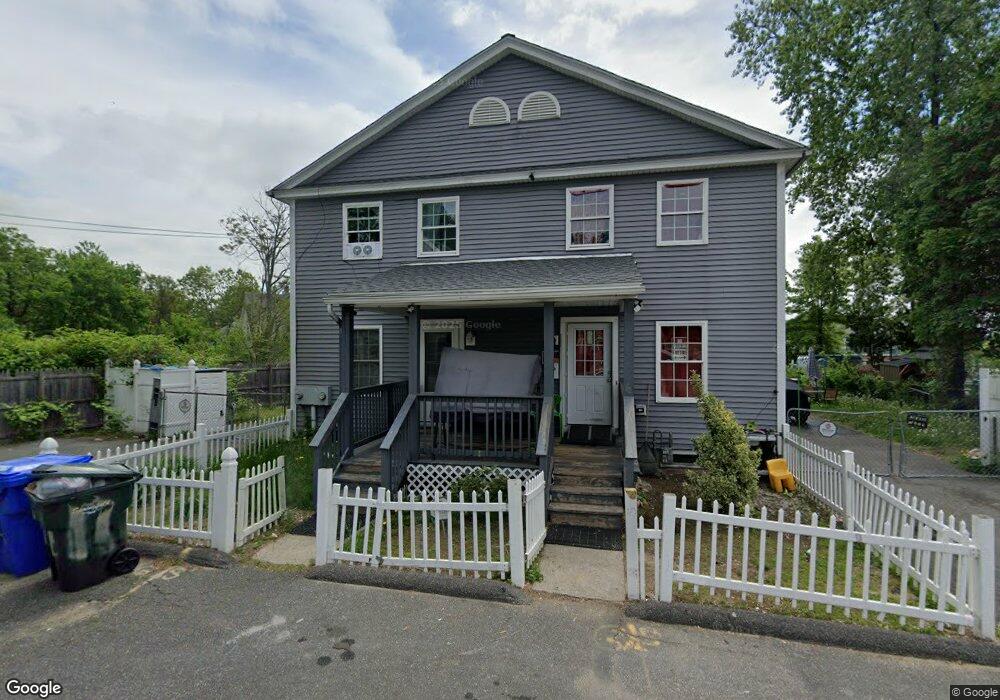
15 Searle Place Unit 17 Springfield, MA 01105
Old Hill NeighborhoodEstimated Value: $337,320 - $399,000
6
Beds
4
Baths
2,560
Sq Ft
$143/Sq Ft
Est. Value
About This Home
This home is located at 15 Searle Place Unit 17, Springfield, MA 01105 and is currently estimated at $366,580, approximately $143 per square foot. 15 Searle Place Unit 17 is a home located in Hampden County with nearby schools including Elias Brookings School, M Marcus Kiley Middle, and High School Of Commerce.
Ownership History
Date
Name
Owned For
Owner Type
Purchase Details
Closed on
Apr 30, 2009
Sold by
Sanchez Felix and Sierra-Sanchez Carmen
Bought by
Lozada Marisol
Current Estimated Value
Home Financials for this Owner
Home Financials are based on the most recent Mortgage that was taken out on this home.
Original Mortgage
$119,350
Outstanding Balance
$75,449
Interest Rate
4.86%
Mortgage Type
Purchase Money Mortgage
Estimated Equity
$291,131
Purchase Details
Closed on
Nov 9, 2004
Sold by
Sanchez Felix
Bought by
Sanchez Carmen Sierra and Sanchez Felix
Purchase Details
Closed on
Oct 21, 2004
Sold by
Orleans Rt and Jones Cynthia L
Bought by
Jones Icie B
Purchase Details
Closed on
Dec 29, 1987
Sold by
Spfd Inner City Rhb
Bought by
Jones Icie B
Create a Home Valuation Report for This Property
The Home Valuation Report is an in-depth analysis detailing your home's value as well as a comparison with similar homes in the area
Home Values in the Area
Average Home Value in this Area
Purchase History
| Date | Buyer | Sale Price | Title Company |
|---|---|---|---|
| Lozada Marisol | $155,000 | -- | |
| Sanchez Carmen Sierra | -- | -- | |
| Jones Icie B | -- | -- | |
| Jones Icie B | $80,000 | -- |
Source: Public Records
Mortgage History
| Date | Status | Borrower | Loan Amount |
|---|---|---|---|
| Open | Lozada Marisol | $119,350 | |
| Closed | Jones Icie B | $31,000 | |
| Closed | Jones Icie B | $5,000 | |
| Previous Owner | Jones Icie B | $57,000 | |
| Previous Owner | Jones Icie B | $75,000 |
Source: Public Records
Tax History Compared to Growth
Tax History
| Year | Tax Paid | Tax Assessment Tax Assessment Total Assessment is a certain percentage of the fair market value that is determined by local assessors to be the total taxable value of land and additions on the property. | Land | Improvement |
|---|---|---|---|---|
| 2025 | $4,268 | $272,200 | $26,500 | $245,700 |
| 2024 | $4,124 | $256,800 | $24,700 | $232,100 |
| 2023 | $3,777 | $219,700 | $23,600 | $196,100 |
| 2022 | $3,314 | $176,100 | $21,500 | $154,600 |
| 2021 | $3,423 | $181,100 | $19,500 | $161,600 |
| 2020 | $3,351 | $171,600 | $19,500 | $152,100 |
| 2019 | $2,771 | $140,800 | $19,500 | $121,300 |
| 2018 | $2,783 | $141,400 | $19,500 | $121,900 |
| 2017 | $2,894 | $147,200 | $15,600 | $131,600 |
| 2016 | $2,693 | $137,000 | $15,600 | $121,400 |
| 2015 | $2,571 | $130,700 | $15,600 | $115,100 |
Source: Public Records
Map
Nearby Homes
- 15-17 Searle Place
- 17 Searle Place
- 9 Searle Place
- 20 Marshall St Unit 22
- 7 Searle Place
- 18 Searle Place Unit 20
- 18-20 Searle Place
- 30 Marshall St
- 10 Melrose St Unit 12
- 373 Walnut St
- 16 Melrose St
- 45 Manhattan St
- 34 Marshall St
- 29 Manhattan St
- 26 Crosby St
- 369 Walnut St
- 369R Walnut St
- 25 Manhattan St
- 49 Manhattan St
- 40 Marshall St