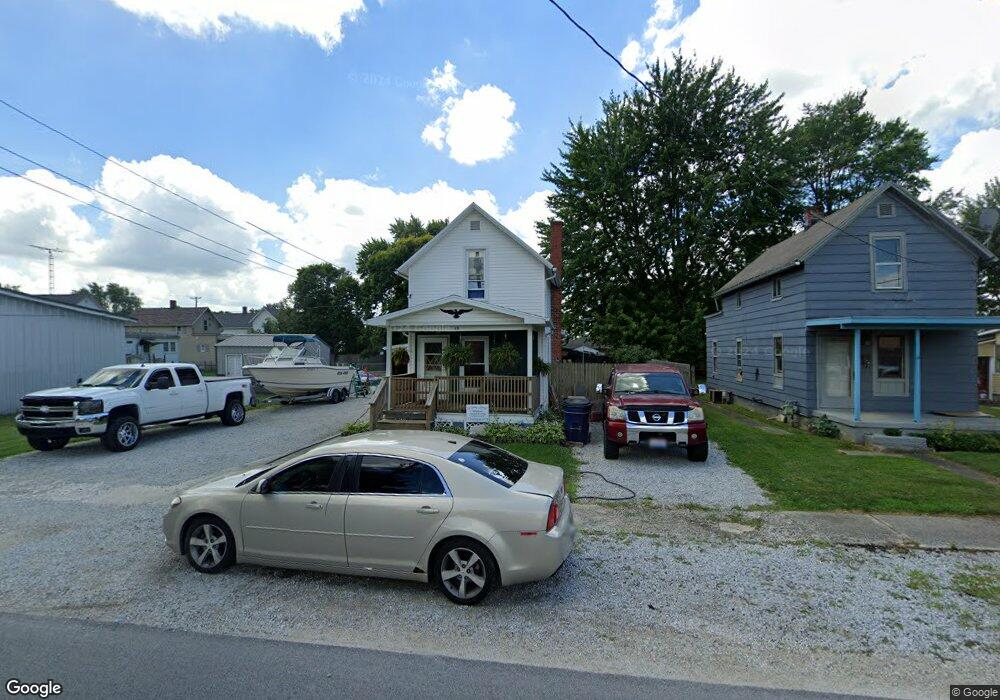
15 Seneca St Tiffin, OH 44883
Estimated Value: $128,000 - $140,497
3
Beds
1
Bath
1,168
Sq Ft
$116/Sq Ft
Est. Value
About This Home
This home is located at 15 Seneca St, Tiffin, OH 44883 and is currently estimated at $135,124, approximately $115 per square foot. 15 Seneca St is a home located in Seneca County with nearby schools including Columbian High School, Calvert High School, and Calvert Catholic Elementary School.
Ownership History
Date
Name
Owned For
Owner Type
Purchase Details
Closed on
Nov 14, 2016
Sold by
Houck Nicole M and Monaco Daniel M
Bought by
Monaco Daniel M
Current Estimated Value
Purchase Details
Closed on
Mar 16, 2004
Sold by
Yoder Lisa J
Bought by
Houck Nicole M
Purchase Details
Closed on
Aug 17, 2001
Sold by
Traxler Daniel J
Bought by
Yoder Lisa J
Purchase Details
Closed on
Oct 11, 1996
Sold by
Scott William C
Bought by
Scott William C
Purchase Details
Closed on
Apr 23, 1996
Sold by
Scott William C
Bought by
Scott William C
Create a Home Valuation Report for This Property
The Home Valuation Report is an in-depth analysis detailing your home's value as well as a comparison with similar homes in the area
Home Values in the Area
Average Home Value in this Area
Purchase History
| Date | Buyer | Sale Price | Title Company |
|---|---|---|---|
| Monaco Daniel M | -- | Assured Title | |
| Houck Nicole M | $73,500 | -- | |
| Yoder Lisa J | $68,000 | -- | |
| Scott William C | $39,500 | -- | |
| Scott William C | -- | -- |
Source: Public Records
Tax History Compared to Growth
Tax History
| Year | Tax Paid | Tax Assessment Tax Assessment Total Assessment is a certain percentage of the fair market value that is determined by local assessors to be the total taxable value of land and additions on the property. | Land | Improvement |
|---|---|---|---|---|
| 2024 | $1,083 | $32,030 | $5,100 | $26,930 |
| 2023 | $1,084 | $32,030 | $5,100 | $26,930 |
| 2022 | $989 | $24,260 | $4,170 | $20,090 |
| 2021 | $997 | $24,260 | $4,170 | $20,090 |
| 2020 | $1,016 | $24,252 | $4,165 | $20,087 |
| 2019 | $1,029 | $23,772 | $4,081 | $19,691 |
| 2018 | $1,031 | $23,772 | $4,081 | $19,691 |
| 2017 | $999 | $23,772 | $4,081 | $19,691 |
| 2016 | $966 | $22,600 | $3,959 | $18,641 |
| 2015 | $955 | $22,600 | $3,959 | $18,641 |
| 2014 | $900 | $22,600 | $3,959 | $18,641 |
| 2013 | $960 | $23,233 | $4,081 | $19,152 |
Source: Public Records
Map
Nearby Homes