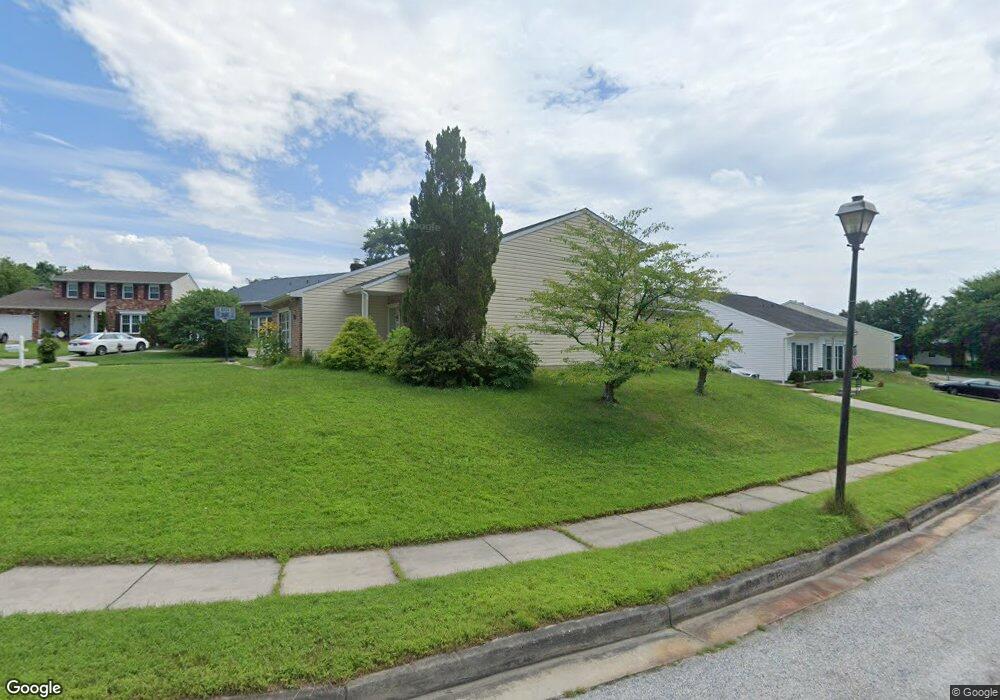
15 Shawn Ct Nottingham, MD 21236
Estimated Value: $449,000 - $526,000
Studio
2
Baths
2,424
Sq Ft
$195/Sq Ft
Est. Value
About This Home
This home is located at 15 Shawn Ct, Nottingham, MD 21236 and is currently estimated at $471,707, approximately $194 per square foot. 15 Shawn Ct is a home located in Baltimore County with nearby schools including Honeygo Elementary School, Perry Hall Middle School, and Perry Hall High School.
Ownership History
Date
Name
Owned For
Owner Type
Purchase Details
Closed on
May 31, 2013
Sold by
Kousantonis John and Koutsantoni Tanya
Bought by
Koutsantonis John
Current Estimated Value
Home Financials for this Owner
Home Financials are based on the most recent Mortgage that was taken out on this home.
Original Mortgage
$216,000
Outstanding Balance
$152,964
Interest Rate
3.39%
Mortgage Type
New Conventional
Estimated Equity
$318,743
Purchase Details
Closed on
Aug 20, 2004
Sold by
Reynolds Edwin J
Bought by
Koutsantonis John and Koutsantonis Tanya
Purchase Details
Closed on
Jul 26, 2004
Sold by
Reynolds Edwin J
Bought by
Koutsantonis John and Koutsantonis Tanya
Purchase Details
Closed on
Oct 25, 1999
Sold by
Brown James A
Bought by
Reynolds Edwin J
Purchase Details
Closed on
Aug 16, 1979
Sold by
Macks and Macks In Corporated
Bought by
Brown James A
Create a Home Valuation Report for This Property
The Home Valuation Report is an in-depth analysis detailing your home's value as well as a comparison with similar homes in the area
Home Values in the Area
Average Home Value in this Area
Purchase History
| Date | Buyer | Sale Price | Title Company |
|---|---|---|---|
| Koutsantonis John | -- | None Available | |
| Koutsantonis John | $255,000 | -- | |
| Koutsantonis John | $255,000 | -- | |
| Koutsantonis John | $255,000 | -- | |
| Koutsantonis John | $255,000 | -- | |
| Reynolds Edwin J | $152,900 | -- | |
| Brown James A | $14,900 | -- |
Source: Public Records
Mortgage History
| Date | Status | Borrower | Loan Amount |
|---|---|---|---|
| Open | Koutsantonis John | $216,000 |
Source: Public Records
Tax History Compared to Growth
Tax History
| Year | Tax Paid | Tax Assessment Tax Assessment Total Assessment is a certain percentage of the fair market value that is determined by local assessors to be the total taxable value of land and additions on the property. | Land | Improvement |
|---|---|---|---|---|
| 2025 | $5,202 | $360,067 | -- | -- |
| 2024 | $5,202 | $335,033 | $0 | $0 |
| 2023 | $2,500 | $310,000 | $90,000 | $220,000 |
| 2022 | $4,743 | $302,533 | $0 | $0 |
| 2021 | $4,392 | $295,067 | $0 | $0 |
| 2020 | $4,392 | $287,600 | $90,000 | $197,600 |
| 2019 | $4,759 | $285,467 | $0 | $0 |
| 2018 | $4,379 | $283,333 | $0 | $0 |
| 2017 | $4,177 | $281,200 | $0 | $0 |
| 2016 | $3,300 | $279,033 | $0 | $0 |
| 2015 | $3,300 | $276,867 | $0 | $0 |
| 2014 | $3,300 | $274,700 | $0 | $0 |
Source: Public Records
Map
Nearby Homes
- 24 Shawn Ct
- 4505 King George Ct
- 4401 E Joppa Rd
- 9018 Gardenia Rd
- 9213 Ramblebrook Rd
- 9212 Snyder Ln
- 9026 Carlisle Ave
- 4410 Vale Dr
- 4411 Ebenezer Rd
- 4501 Sandra Lake Rd
- 8929 Yvonne Ave
- 8736H Gerst Ave
- 4232 E Joppa Rd
- 4835 Grandiflora Cir
- 4503 Hershey Way
- 4219 Darnall Rd
- 23 Bartley Ct
- 4217 Darnall Rd
- 22 Hobb Ct
- 4818 Grandiflora Cir