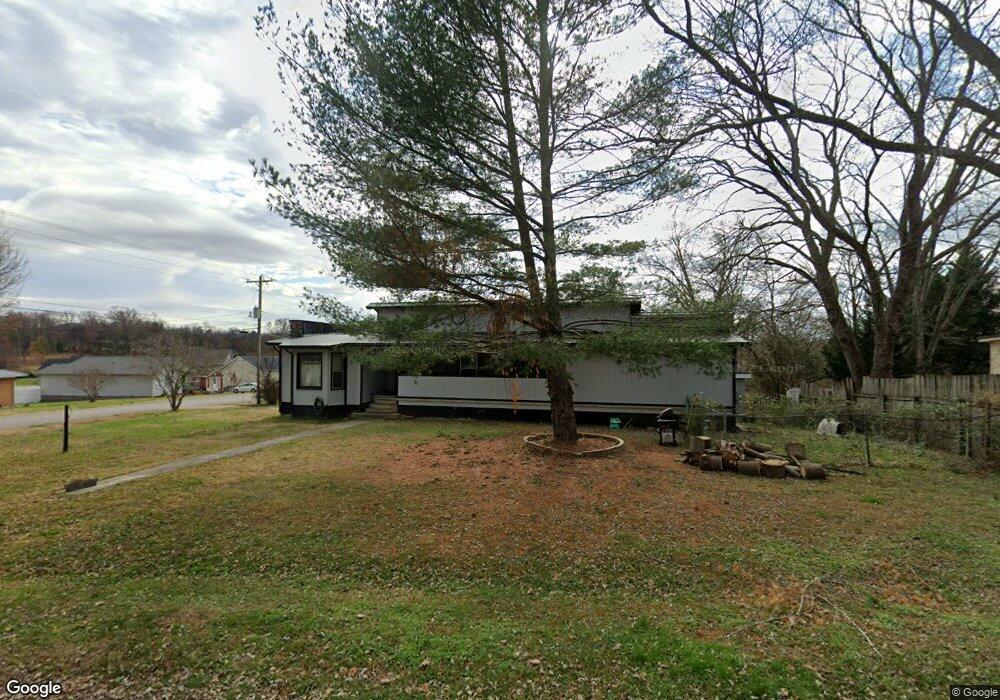
15 Sherry St Winchester, TN 37398
Estimated Value: $119,000 - $232,000
Studio
1
Bath
1,180
Sq Ft
$149/Sq Ft
Est. Value
About This Home
This home is located at 15 Sherry St, Winchester, TN 37398 and is currently estimated at $175,771, approximately $148 per square foot. 15 Sherry St is a home located in Franklin County with nearby schools including South Middle School, Franklin County High School, and Winchester Christian Academy.
Ownership History
Date
Name
Owned For
Owner Type
Purchase Details
Closed on
Apr 19, 2006
Sold by
Deutsche Bank National Tru
Bought by
Kelley Ronnie
Current Estimated Value
Home Financials for this Owner
Home Financials are based on the most recent Mortgage that was taken out on this home.
Original Mortgage
$32,300
Outstanding Balance
$18,280
Interest Rate
6.29%
Estimated Equity
$157,491
Purchase Details
Closed on
Dec 1, 2005
Bought by
Deutsche Bank National Tru
Purchase Details
Closed on
Dec 11, 1992
Bought by
Godsey Gary A
Purchase Details
Closed on
Nov 23, 1992
Bought by
Tucker Howard C and Tucker Margaret A
Purchase Details
Closed on
Jul 29, 1992
Bought by
Tucker Howard C and Tucker Margaret A
Purchase Details
Closed on
Aug 28, 1991
Bought by
Taylor Stanley W and Taylor Mattie A
Purchase Details
Closed on
Jan 23, 1981
Bought by
Sanders Sherrill V and Sandra Gail
Purchase Details
Closed on
Jul 12, 1980
Create a Home Valuation Report for This Property
The Home Valuation Report is an in-depth analysis detailing your home's value as well as a comparison with similar homes in the area
Home Values in the Area
Average Home Value in this Area
Purchase History
| Date | Buyer | Sale Price | Title Company |
|---|---|---|---|
| Kelley Ronnie | $34,000 | -- | |
| Deutsche Bank National Tru | $48,600 | -- | |
| Godsey Gary A | $33,000 | -- | |
| Tucker Howard C | -- | -- | |
| Tucker Howard C | -- | -- | |
| Taylor Stanley W | -- | -- | |
| Sanders Sherrill V | -- | -- | |
| -- | -- | -- |
Source: Public Records
Mortgage History
| Date | Status | Borrower | Loan Amount |
|---|---|---|---|
| Open | Not Available | $32,300 |
Source: Public Records
Tax History
| Year | Tax Paid | Tax Assessment Tax Assessment Total Assessment is a certain percentage of the fair market value that is determined by local assessors to be the total taxable value of land and additions on the property. | Land | Improvement |
|---|---|---|---|---|
| 2025 | -- | $21,750 | $2,550 | $19,200 |
| 2024 | -- | $21,750 | $2,550 | $19,200 |
| 2023 | $559 | $21,750 | $2,550 | $19,200 |
| 2022 | $548 | $21,750 | $2,550 | $19,200 |
| 2021 | $389 | $21,750 | $2,550 | $19,200 |
| 2020 | $537 | $15,175 | $1,750 | $13,425 |
| 2019 | $537 | $15,175 | $1,750 | $13,425 |
| 2018 | $506 | $15,175 | $1,750 | $13,425 |
| 2017 | $506 | $15,175 | $1,750 | $13,425 |
| 2016 | $469 | $14,100 | $1,750 | $12,350 |
| 2015 | $461 | $14,100 | $1,750 | $12,350 |
| 2014 | $461 | $14,107 | $0 | $0 |
Source: Public Records
Map
Nearby Homes
- 0 Sherry St
- 305 Duncan Ln
- 65 Duncan Ln
- 347 Campfire Ct
- 319 Campfire Ct
- 65 Pontoon Place
- 171 Cypress Point Dr
- 155 Cypress Point Dr
- 101 Cypress Point Dr
- 974 Lynchburg Rd
- 50 Pontoon Place
- 146 Island Way
- 443 Canoe Ct
- 73 Cypress Point Dr
- 52 Island Way
- 22 Driftwood Ct
- 120 Pontoon Place
- 0 Driftwood Ct Unit RTC2985981
- 0 Driftwood Ct Unit RTC3129033
- 0 Canoe Ct Unit RTC2695309
Your Personal Tour Guide
Ask me questions while you tour the home.