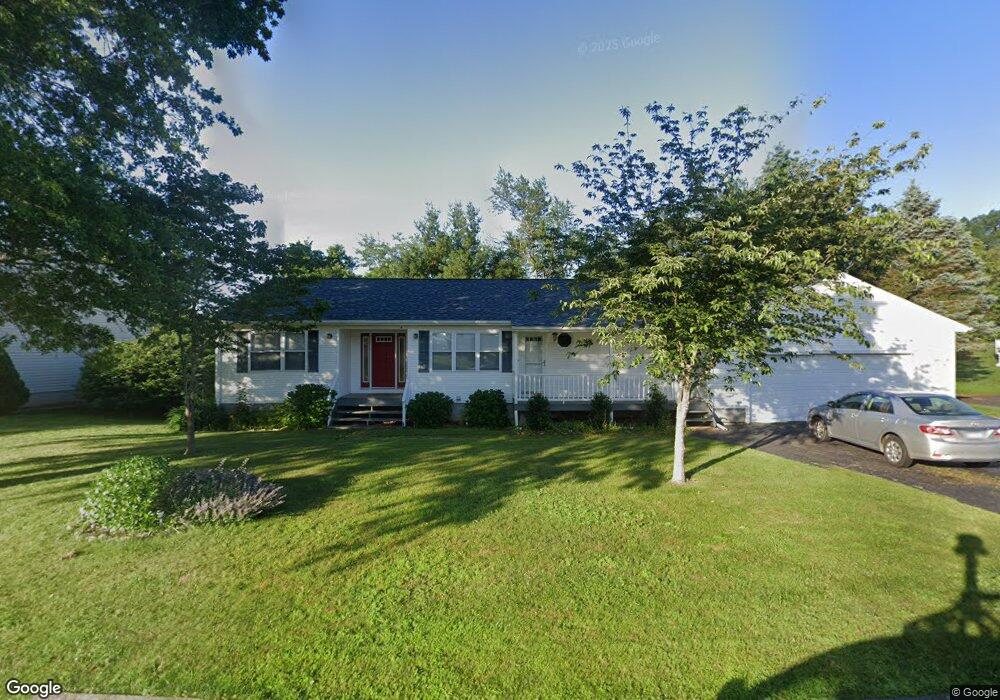
15 Sobin Dr Ansonia, CT 06401
Estimated Value: $442,258 - $721,000
3
Beds
2
Baths
1,593
Sq Ft
$339/Sq Ft
Est. Value
About This Home
This home is located at 15 Sobin Dr, Ansonia, CT 06401 and is currently estimated at $539,815, approximately $338 per square foot. 15 Sobin Dr is a home located in New Haven County with nearby schools including Ansonia Middle School, Ansonia High School, and St Mary & St Michael School.
Ownership History
Date
Name
Owned For
Owner Type
Purchase Details
Closed on
Nov 18, 2011
Sold by
Mayo George
Bought by
Jankowski Henry
Current Estimated Value
Home Financials for this Owner
Home Financials are based on the most recent Mortgage that was taken out on this home.
Original Mortgage
$238,500
Outstanding Balance
$17,235
Interest Rate
3.92%
Estimated Equity
$522,580
Purchase Details
Closed on
Oct 27, 1994
Sold by
Monaco Maureen E
Bought by
Mayo George F and Euwema Margaret E
Create a Home Valuation Report for This Property
The Home Valuation Report is an in-depth analysis detailing your home's value as well as a comparison with similar homes in the area
Home Values in the Area
Average Home Value in this Area
Purchase History
| Date | Buyer | Sale Price | Title Company |
|---|---|---|---|
| Jankowski Henry | $265,000 | -- | |
| Mayo George F | $195,800 | -- |
Source: Public Records
Mortgage History
| Date | Status | Borrower | Loan Amount |
|---|---|---|---|
| Open | Mayo George F | $238,500 | |
| Previous Owner | Mayo George F | $20,000 | |
| Previous Owner | Mayo George F | $200,000 | |
| Previous Owner | Mayo George F | $171,000 |
Source: Public Records
Tax History
| Year | Tax Paid | Tax Assessment Tax Assessment Total Assessment is a certain percentage of the fair market value that is determined by local assessors to be the total taxable value of land and additions on the property. | Land | Improvement |
|---|---|---|---|---|
| 2025 | $7,544 | $264,250 | $66,500 | $197,750 |
| 2024 | $7,000 | $264,250 | $66,500 | $197,750 |
| 2023 | $6,934 | $264,250 | $66,500 | $197,750 |
| 2022 | $7,401 | $195,800 | $66,400 | $129,400 |
| 2021 | $9,011 | $195,800 | $66,400 | $129,400 |
| 2020 | $7,401 | $195,800 | $66,400 | $129,400 |
| 2019 | $7,401 | $195,800 | $66,400 | $129,400 |
| 2018 | $7,307 | $195,800 | $66,400 | $129,400 |
| 2017 | $6,852 | $183,600 | $63,300 | $120,300 |
| 2016 | $6,852 | $183,600 | $63,300 | $120,300 |
| 2015 | $6,889 | $183,600 | $63,300 | $120,300 |
| 2014 | $7,089 | $183,600 | $63,300 | $120,300 |
| 2013 | $7,223 | $183,600 | $63,300 | $120,300 |
Source: Public Records
Map
Nearby Homes
Your Personal Tour Guide
Ask me questions while you tour the home.