Estimated Value: $484,000 - $653,000
3
Beds
3
Baths
1,928
Sq Ft
$300/Sq Ft
Est. Value
About This Home
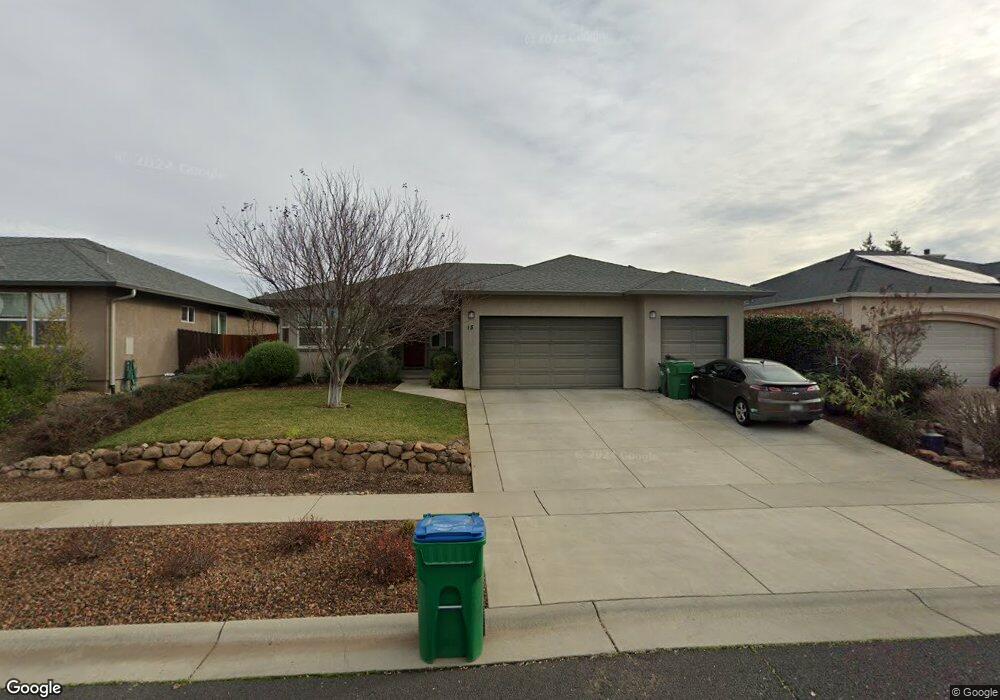
This home is located at 15 Stonehaven Ct, Chico, CA 95928 and is currently estimated at $577,779, approximately $299 per square foot. 15 Stonehaven Ct is a home with nearby schools including Little Chico Creek Elementary School, Harry M. Marsh Junior High School, and Chico High School.
Ownership History
Date
Name
Owned For
Owner Type
Purchase Details
Closed on
Feb 10, 2021
Sold by
Holt Robert
Bought by
Holt Dora and Holt Robert
Current Estimated Value
Purchase Details
Closed on
Oct 1, 2015
Sold by
Holt Dora
Bought by
Holt Robert
Home Financials for this Owner
Home Financials are based on the most recent Mortgage that was taken out on this home.
Original Mortgage
$348,440
Outstanding Balance
$274,242
Interest Rate
3.89%
Mortgage Type
New Conventional
Estimated Equity
$303,537
Purchase Details
Closed on
Nov 5, 2014
Sold by
Ridgecrest Property Group Llc
Bought by
Bill Webb Construction Inc
Purchase Details
Closed on
Aug 17, 2011
Sold by
Umpqua Bank
Bought by
Ridgecrest Property Group Llc
Purchase Details
Closed on
May 18, 2011
Sold by
Mbd Inc
Bought by
Umpqua Bank
Create a Home Valuation Report for This Property
The Home Valuation Report is an in-depth analysis detailing your home's value as well as a comparison with similar homes in the area
Home Values in the Area
Average Home Value in this Area
Purchase History
| Date | Buyer | Sale Price | Title Company |
|---|---|---|---|
| Holt Dora | -- | Mid Valley Title & Escrow Co | |
| Holt Robert | -- | Mid Valley Title & Escrow Co | |
| Holt Robert | $367,000 | Mid Valley Title & Escrow Co | |
| Bill Webb Construction Inc | -- | Mid Valley Title & Escrow Co | |
| Ridgecrest Property Group Llc | -- | Placer Title Company | |
| Umpqua Bank | $3,200,000 | None Available |
Source: Public Records
Mortgage History
| Date | Status | Borrower | Loan Amount |
|---|---|---|---|
| Open | Holt Robert | $348,440 |
Source: Public Records
Tax History Compared to Growth
Tax History
| Year | Tax Paid | Tax Assessment Tax Assessment Total Assessment is a certain percentage of the fair market value that is determined by local assessors to be the total taxable value of land and additions on the property. | Land | Improvement |
|---|---|---|---|---|
| 2025 | $4,821 | $434,447 | $153,891 | $280,556 |
| 2024 | $4,821 | $425,929 | $150,874 | $275,055 |
| 2023 | $4,785 | $417,578 | $147,916 | $269,662 |
| 2022 | $4,680 | $409,391 | $145,016 | $264,375 |
| 2021 | $4,615 | $401,365 | $142,173 | $259,192 |
| 2020 | $4,597 | $397,251 | $140,716 | $256,535 |
| 2019 | $4,515 | $389,462 | $137,957 | $251,505 |
| 2018 | $4,365 | $381,826 | $135,252 | $246,574 |
| 2017 | $4,253 | $374,340 | $132,600 | $241,740 |
| 2016 | $3,863 | $367,000 | $130,000 | $237,000 |
| 2015 | $977 | $84,300 | $84,300 | $0 |
| 2014 | $723 | $53,280 | $53,280 | $0 |
Source: Public Records
Map
Nearby Homes
- 2869 Longwood Dr
- 2886 Wingfield Ave
- 48 Quillstone Loop
- 1971 Potter Rd
- 1921 Ascolano Way
- 1916 Potter Rd
- 2509 England St
- 1814 Roth St
- 2234 Hutchinson St
- 0 Bruce Rd Unit SN25051893
- 0 Bruce Rd Unit SN25051885
- 0 Coyote Way Unit SN25050197
- 18 Jasper Dr
- 1110 Shumard Oak Way
- 664 Stilson Canyon Rd
- 1 Parkhurst St
- 0 Stilson Canyon Rd Unit SN24199304
- 2099 Hartford Dr Unit 8
- 2099 Hartford Dr Unit 20
- 2066 Chadwick Dr
- 16 Stonehaven Ct Unit 100
- 16 Stonehaven Ct
- 14 Stonehaven Ct
- 3 Quillstone Loop
- 13 Stonehaven Ct
- 1 Quillstone Loop
- 5 Quillstone Loop
- 2 Stonehaven Ct
- 7 Quillstone Loop
- 3 Stonehaven Ct
- 1 Stonehaven Ct
- 12 Stonehaven Ct
- 2873 Longwood Dr
- 2877 Longwood Dr
- 4 Stonehaven Ct
- 2881 Longwood Dr
- 9 Quillstone Loop
- 2889 Longwood Dr
- 2865 Longwood Dr
- 5 Stonehaven Ct