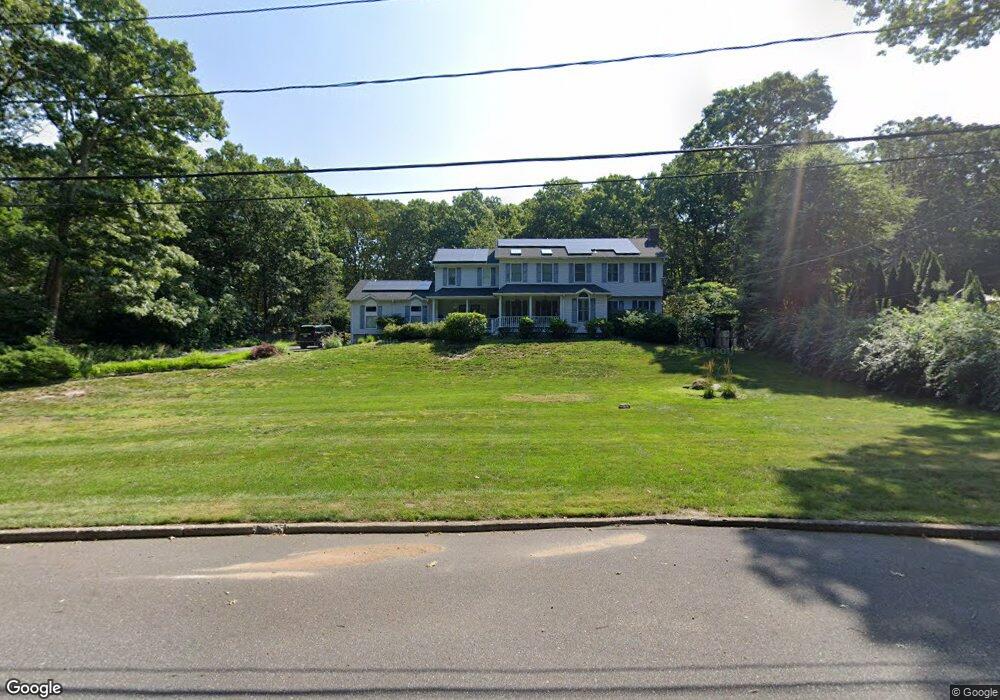
15 Sylvester Rd Wading River, NY 11792
East Shoreham NeighborhoodEstimated Value: $1,116,000 - $1,292,000
5
Beds
5
Baths
4,188
Sq Ft
$287/Sq Ft
Est. Value
About This Home
This home is located at 15 Sylvester Rd, Wading River, NY 11792 and is currently estimated at $1,201,797, approximately $286 per square foot. 15 Sylvester Rd is a home located in Suffolk County with nearby schools including Wading River School, Miller Avenue School, and Albert G Prodell Middle School.
Ownership History
Date
Name
Owned For
Owner Type
Purchase Details
Closed on
Oct 22, 2018
Sold by
Testa Michele
Bought by
Nankervis Denis J and Coppola Lauren H
Current Estimated Value
Home Financials for this Owner
Home Financials are based on the most recent Mortgage that was taken out on this home.
Original Mortgage
$564,300
Outstanding Balance
$483,693
Interest Rate
4.6%
Mortgage Type
New Conventional
Estimated Equity
$718,104
Purchase Details
Closed on
Jun 27, 2005
Purchase Details
Closed on
Sep 2, 2004
Sold by
Aracri Family Limited Par T.
Bought by
Kitz Michele
Purchase Details
Closed on
Feb 9, 2001
Sold by
Aracri Ann
Bought by
Aracri Family Lp
Home Financials for this Owner
Home Financials are based on the most recent Mortgage that was taken out on this home.
Original Mortgage
$266,250
Interest Rate
7.15%
Purchase Details
Closed on
Sep 9, 1995
Sold by
Aracri Joseph S and Aracri Ann
Bought by
Aracri Ann
Create a Home Valuation Report for This Property
The Home Valuation Report is an in-depth analysis detailing your home's value as well as a comparison with similar homes in the area
Home Values in the Area
Average Home Value in this Area
Purchase History
| Date | Buyer | Sale Price | Title Company |
|---|---|---|---|
| Nankervis Denis J | $627,000 | -- | |
| -- | -- | -- | |
| Kitz Michele | $570,000 | Dennis Reiss | |
| Aracri Family Lp | -- | Stewart Title | |
| Aracri Ann | -- | Stewart Title | |
| Aracri Ann | -- | First American Title Ins Co |
Source: Public Records
Mortgage History
| Date | Status | Borrower | Loan Amount |
|---|---|---|---|
| Open | Nankervis Denis J | $564,300 | |
| Previous Owner | Aracri Ann | $266,250 |
Source: Public Records
Tax History Compared to Growth
Tax History
| Year | Tax Paid | Tax Assessment Tax Assessment Total Assessment is a certain percentage of the fair market value that is determined by local assessors to be the total taxable value of land and additions on the property. | Land | Improvement |
|---|---|---|---|---|
| 2024 | $16,670 | $4,265 | $300 | $3,965 |
| 2023 | $16,670 | $4,265 | $300 | $3,965 |
| 2022 | $14,747 | $4,265 | $300 | $3,965 |
| 2021 | $14,747 | $4,265 | $300 | $3,965 |
| 2020 | $15,116 | $4,265 | $300 | $3,965 |
| 2019 | $15,116 | $0 | $0 | $0 |
| 2018 | $14,540 | $4,265 | $300 | $3,965 |
| 2017 | $14,540 | $4,265 | $300 | $3,965 |
| 2016 | $14,478 | $4,265 | $300 | $3,965 |
| 2015 | -- | $4,265 | $300 | $3,965 |
| 2014 | -- | $4,265 | $300 | $3,965 |
Source: Public Records
Map
Nearby Homes
- 12 Russell Dr
- 1459 N Country Rd
- 31 Remsen Rd
- 43 Hill St
- 60 Randall Rd
- 6 Ring Neck Ct
- 3 Pheasant Run
- 6295 N Country Rd
- 15 Hermitage St
- 52 Laurel Ct
- 0 Sound Rd
- 28 Plain View Dr
- 9 Deerfield Dr
- 0 Route 25A Unit ONE3585320
- 16 Rocklein Rd
- 1799 Wading River Manor Rd
- 2353 N Wading River Rd
- 2354 N Wading River Rd
- 123 South Rd
- 167 Farm Rd E