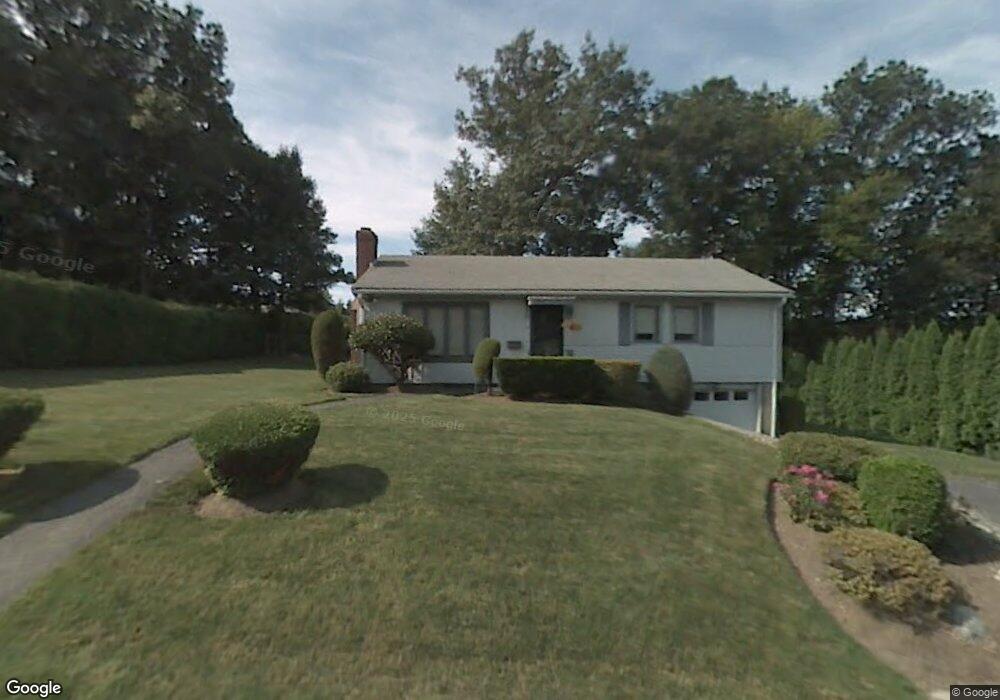
15 Terrence Ave Clinton, MA 01510
Estimated Value: $411,000 - $478,000
3
Beds
1
Bath
1,092
Sq Ft
$408/Sq Ft
Est. Value
About This Home
This home is located at 15 Terrence Ave, Clinton, MA 01510 and is currently estimated at $445,314, approximately $407 per square foot. 15 Terrence Ave is a home located in Worcester County with nearby schools including Clinton Senior High School, Clinton Elementary School, and Clinton Middle School.
Ownership History
Date
Name
Owned For
Owner Type
Purchase Details
Closed on
Jun 23, 2011
Sold by
15 Terrence Ave Rt and Goldstein Sherri L
Bought by
Delaney Jason and Delaney Pamela
Current Estimated Value
Home Financials for this Owner
Home Financials are based on the most recent Mortgage that was taken out on this home.
Original Mortgage
$185,183
Outstanding Balance
$128,378
Interest Rate
4.75%
Mortgage Type
FHA
Estimated Equity
$316,936
Purchase Details
Closed on
Jan 15, 2010
Sold by
Goldstein Autusta
Bought by
Goldstein Tr Augusta L and Goldstein Sherri L
Create a Home Valuation Report for This Property
The Home Valuation Report is an in-depth analysis detailing your home's value as well as a comparison with similar homes in the area
Home Values in the Area
Average Home Value in this Area
Purchase History
| Date | Buyer | Sale Price | Title Company |
|---|---|---|---|
| Delaney Jason | $190,000 | -- | |
| Goldstein Tr Augusta L | -- | -- |
Source: Public Records
Mortgage History
| Date | Status | Borrower | Loan Amount |
|---|---|---|---|
| Open | Delaney Jason | $185,183 |
Source: Public Records
Tax History
| Year | Tax Paid | Tax Assessment Tax Assessment Total Assessment is a certain percentage of the fair market value that is determined by local assessors to be the total taxable value of land and additions on the property. | Land | Improvement |
|---|---|---|---|---|
| 2025 | $4,577 | $344,100 | $116,500 | $227,600 |
| 2024 | $4,292 | $326,600 | $116,500 | $210,100 |
| 2023 | $4,006 | $299,600 | $105,900 | $193,700 |
| 2022 | $3,985 | $267,300 | $96,300 | $171,000 |
| 2021 | $4,047 | $253,900 | $91,700 | $162,200 |
| 2020 | $3,933 | $253,900 | $91,700 | $162,200 |
| 2019 | $3,744 | $235,000 | $89,100 | $145,900 |
| 2018 | $3,676 | $216,500 | $89,100 | $127,400 |
| 2017 | $3,435 | $194,400 | $89,100 | $105,300 |
| 2016 | $3,280 | $189,900 | $89,100 | $100,800 |
| 2015 | $2,989 | $179,400 | $86,500 | $92,900 |
| 2014 | $2,897 | $179,400 | $86,500 | $92,900 |
Source: Public Records
Map
Nearby Homes
- 355 Main St
- 5 Richman St
- 30 Richman St
- 288 Grove St Unit 288
- 125 Grove St
- 66 Oak St Unit 66
- 115117 Mechanic St Unit 4
- 115117 Mechanic St Unit 3
- 2 Eagle Nest Unit B6-2
- 109 Oak St
- 23 Ash St
- 55 Sterling St Unit 306
- 55 Sterling St Unit 312
- 55 Sterling St Unit 314
- 55 Sterling St Unit 212
- 51 Rigby St
- 229 Sterling St
- 43 Berlin St Unit 411
- 25 Pearl St
- 719 Main St
Your Personal Tour Guide
Ask me questions while you tour the home.