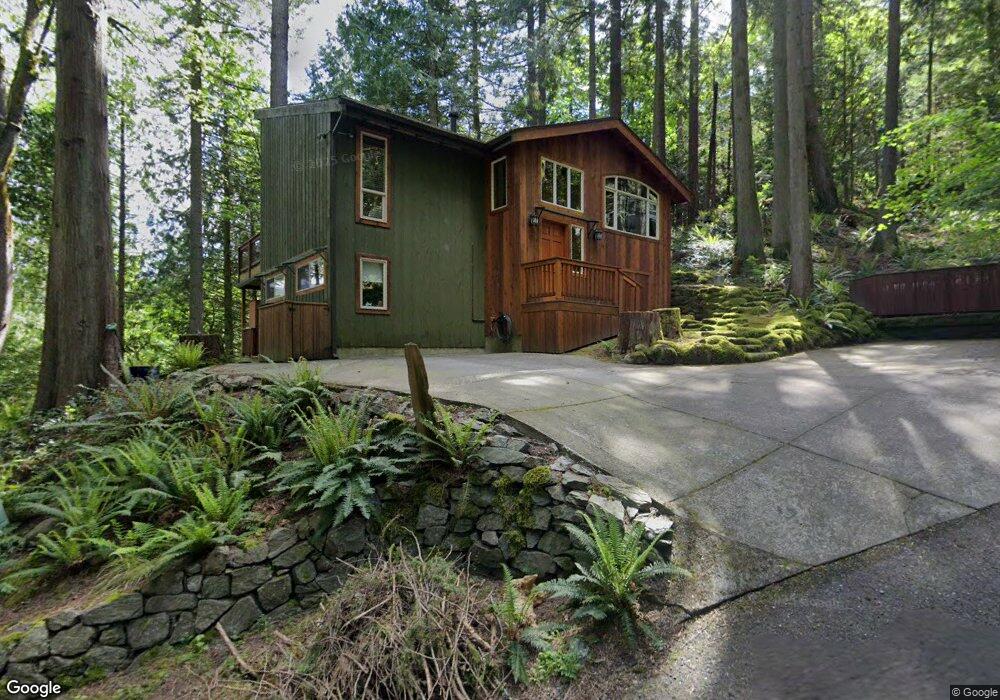
15 Thunder Peak Way Bellingham, WA 98229
Estimated Value: $488,669 - $534,000
3
Beds
2
Baths
1,548
Sq Ft
$331/Sq Ft
Est. Value
About This Home
This home is located at 15 Thunder Peak Way, Bellingham, WA 98229 and is currently estimated at $512,667, approximately $331 per square foot. 15 Thunder Peak Way is a home located in Whatcom County with nearby schools including Geneva Elementary School, Kulshan Middle School, and Bellingham High School.
Create a Home Valuation Report for This Property
The Home Valuation Report is an in-depth analysis detailing your home's value as well as a comparison with similar homes in the area
Home Values in the Area
Average Home Value in this Area
Tax History Compared to Growth
Tax History
| Year | Tax Paid | Tax Assessment Tax Assessment Total Assessment is a certain percentage of the fair market value that is determined by local assessors to be the total taxable value of land and additions on the property. | Land | Improvement |
|---|---|---|---|---|
| 2024 | $3,615 | $410,543 | $182,142 | $228,401 |
| 2023 | $3,615 | $413,050 | $183,254 | $229,796 |
| 2022 | $2,860 | $356,088 | $157,982 | $198,106 |
| 2021 | $2,747 | $258,035 | $114,480 | $143,555 |
| 2020 | $2,681 | $243,429 | $108,000 | $135,429 |
| 2019 | $2,439 | $236,713 | $86,304 | $150,409 |
| 2018 | $2,447 | $222,245 | $81,000 | $141,245 |
| 2017 | $2,064 | $189,910 | $69,188 | $120,722 |
| 2016 | $1,853 | $167,019 | $60,750 | $106,269 |
| 2015 | $1,855 | $157,091 | $57,904 | $99,187 |
| 2014 | -- | $152,604 | $56,250 | $96,354 |
| 2013 | -- | $171,585 | $76,650 | $94,935 |
Source: Public Records
Map
Nearby Homes
- 137 Sudden Valley Dr
- 20 Hillside Place
- 34 Green Hill Rd
- 5 Stable Ln
- 39 Stable Ln
- 209 Harbor View Dr
- 14 Black Bear Ct Unit A
- 196 Sudden Valley Dr
- 7 Deer Run Ln
- 203 Sudden Valley Dr
- 4 Twin Flower Cir
- 275 Sudden Valley Dr
- 69 N Point Dr
- 8 Twin Flower Cir
- 11 Granite Cir
- 46 N Point Dr
- 13 Westbrook Ct
- 11 Fairway Ln
- 3 Huckleberry Ct Unit B
- 40 Morning Glory Dr
- 48 Green Hill Rd
- 17 Thunder Peak Way
- 50 Green Hill Rd
- 46 Green Hill Rd
- 19 Thunder Peak Way
- 10 Thunder Peak Way
- 7 Thunder Peak Way
- 8 Thunder Peak Way
- 1 Jasper Ridge Ln
- 4 Amberland Way
- 55 Green Hill Rd
- 131 Harbor View Dr
- 27 Jasper Ridge Ln
- 15 Amberland Way
- 5 Thunder Peak Way
- 4 Harbor View Dr
- 133 Harbor View Dr
- 136 Harbor View Dr
- 23 Jasper Ridge Ln
- 2 Winter Creek Place