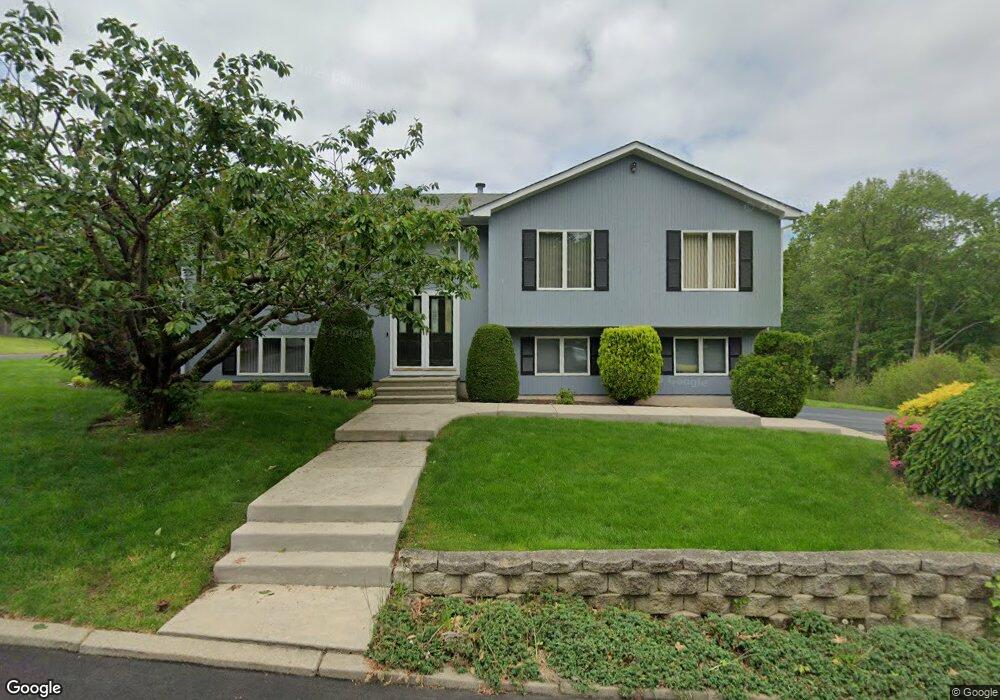
15 Traymore St Cranston, RI 02920
Thornton NeighborhoodEstimated Value: $512,000 - $558,000
3
Beds
2
Baths
1,786
Sq Ft
$300/Sq Ft
Est. Value
About This Home
This home is located at 15 Traymore St, Cranston, RI 02920 and is currently estimated at $536,361, approximately $300 per square foot. 15 Traymore St is a home located in Providence County with nearby schools including Stone Hill School, Western Hills Middle School, and Cranston High School West.
Ownership History
Date
Name
Owned For
Owner Type
Purchase Details
Closed on
May 22, 2017
Sold by
Est Gallonio Anne and Gallonio Anne M
Bought by
Gallonio Andrew M
Current Estimated Value
Home Financials for this Owner
Home Financials are based on the most recent Mortgage that was taken out on this home.
Original Mortgage
$4,300
Outstanding Balance
$2,280
Interest Rate
4.63%
Mortgage Type
Unknown
Estimated Equity
$534,081
Purchase Details
Closed on
Dec 28, 2004
Sold by
Nacci Amedeo and Nacci Lori
Bought by
Gallone Anne
Purchase Details
Closed on
Sep 1, 1988
Sold by
Santurri Richard
Bought by
Nacci Amedeo J
Home Financials for this Owner
Home Financials are based on the most recent Mortgage that was taken out on this home.
Original Mortgage
$125,250
Interest Rate
10.38%
Create a Home Valuation Report for This Property
The Home Valuation Report is an in-depth analysis detailing your home's value as well as a comparison with similar homes in the area
Home Values in the Area
Average Home Value in this Area
Purchase History
| Date | Buyer | Sale Price | Title Company |
|---|---|---|---|
| Gallonio Andrew M | $240,000 | -- | |
| Gallone Anne | $315,000 | -- | |
| Nacci Amedeo J | $167,000 | -- |
Source: Public Records
Mortgage History
| Date | Status | Borrower | Loan Amount |
|---|---|---|---|
| Open | Nacci Amedeo J | $4,300 | |
| Previous Owner | Nacci Amedeo J | $125,250 |
Source: Public Records
Tax History Compared to Growth
Tax History
| Year | Tax Paid | Tax Assessment Tax Assessment Total Assessment is a certain percentage of the fair market value that is determined by local assessors to be the total taxable value of land and additions on the property. | Land | Improvement |
|---|---|---|---|---|
| 2025 | $6,497 | $468,100 | $153,400 | $314,700 |
| 2024 | $6,371 | $468,100 | $153,400 | $314,700 |
| 2023 | $6,222 | $329,200 | $109,700 | $219,500 |
| 2022 | $6,093 | $329,200 | $109,700 | $219,500 |
| 2021 | $5,926 | $329,200 | $109,700 | $219,500 |
| 2020 | $6,131 | $295,200 | $109,700 | $185,500 |
| 2019 | $6,131 | $295,200 | $109,700 | $185,500 |
| 2018 | $5,990 | $295,200 | $109,700 | $185,500 |
| 2017 | $5,854 | $255,200 | $94,100 | $161,100 |
| 2016 | $5,729 | $255,200 | $94,100 | $161,100 |
| 2015 | $5,729 | $255,200 | $94,100 | $161,100 |
| 2014 | $4,471 | $227,100 | $90,100 | $137,000 |
Source: Public Records
Map
Nearby Homes