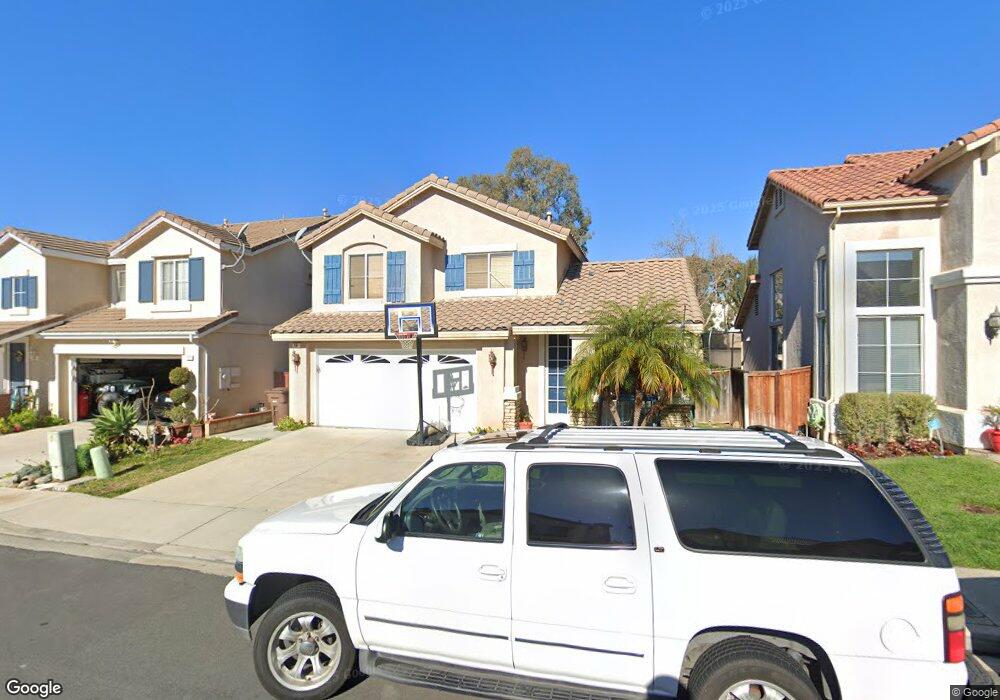
15 Twilight Ln Rancho Santa Margarita, CA 92688
Estimated Value: $1,023,636 - $1,139,000
3
Beds
3
Baths
1,422
Sq Ft
$756/Sq Ft
Est. Value
About This Home
This home is located at 15 Twilight Ln, Rancho Santa Margarita, CA 92688 and is currently estimated at $1,075,159, approximately $756 per square foot. 15 Twilight Ln is a home located in Orange County with nearby schools including Tijeras Creek Elementary School, Las Flores Middle School, and Tesoro High School.
Ownership History
Date
Name
Owned For
Owner Type
Purchase Details
Closed on
Aug 28, 2001
Sold by
Vandorp Holger Rudolf Rainer and Vandorp Kristina Else
Bought by
Acosta Louis R and Acosta Anabell G
Current Estimated Value
Home Financials for this Owner
Home Financials are based on the most recent Mortgage that was taken out on this home.
Original Mortgage
$241,600
Outstanding Balance
$87,334
Interest Rate
5.99%
Estimated Equity
$987,825
Purchase Details
Closed on
May 27, 1998
Sold by
Pulte Home Corp
Bought by
Vandorp Holger Rudolf Rainer and Vandorp Kristina Else
Home Financials for this Owner
Home Financials are based on the most recent Mortgage that was taken out on this home.
Original Mortgage
$171,200
Interest Rate
7.17%
Create a Home Valuation Report for This Property
The Home Valuation Report is an in-depth analysis detailing your home's value as well as a comparison with similar homes in the area
Home Values in the Area
Average Home Value in this Area
Purchase History
| Date | Buyer | Sale Price | Title Company |
|---|---|---|---|
| Acosta Louis R | $302,000 | Southland Title Corporation | |
| Vandorp Holger Rudolf Rainer | $218,500 | First American Title Ins Co |
Source: Public Records
Mortgage History
| Date | Status | Borrower | Loan Amount |
|---|---|---|---|
| Open | Acosta Louis R | $241,600 | |
| Previous Owner | Vandorp Holger Rudolf Rainer | $171,200 |
Source: Public Records
Tax History Compared to Growth
Tax History
| Year | Tax Paid | Tax Assessment Tax Assessment Total Assessment is a certain percentage of the fair market value that is determined by local assessors to be the total taxable value of land and additions on the property. | Land | Improvement |
|---|---|---|---|---|
| 2025 | $4,409 | $446,133 | $261,903 | $184,230 |
| 2024 | $4,409 | $437,386 | $256,768 | $180,618 |
| 2023 | $4,309 | $428,810 | $251,733 | $177,077 |
| 2022 | $4,227 | $420,402 | $246,797 | $173,605 |
| 2021 | $4,147 | $412,159 | $241,958 | $170,201 |
| 2020 | $4,108 | $407,933 | $239,477 | $168,456 |
| 2019 | $4,511 | $399,935 | $234,782 | $165,153 |
| 2018 | $4,439 | $392,094 | $230,179 | $161,915 |
| 2017 | $4,478 | $384,406 | $225,665 | $158,741 |
| 2016 | $4,382 | $376,869 | $221,240 | $155,629 |
| 2015 | $4,426 | $371,209 | $217,917 | $153,292 |
| 2014 | $4,330 | $363,938 | $213,648 | $150,290 |
Source: Public Records
Map
Nearby Homes