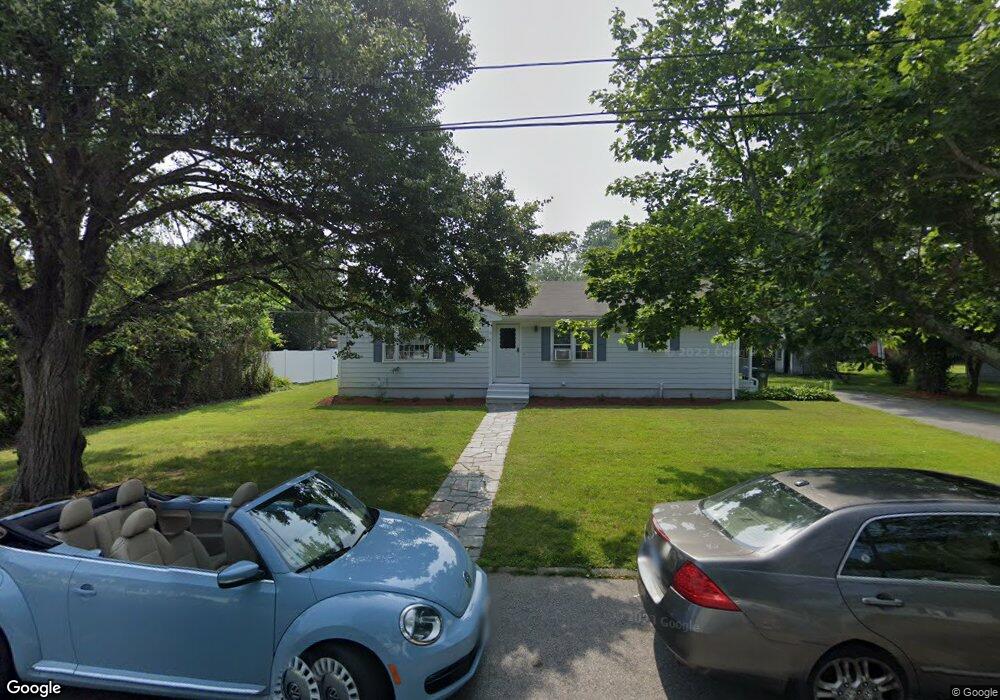
15 Valley Dr Bristol, RI 02809
Mount Hope High School NeighborhoodEstimated Value: $547,703 - $625,000
3
Beds
2
Baths
1,592
Sq Ft
$367/Sq Ft
Est. Value
About This Home
This home is located at 15 Valley Dr, Bristol, RI 02809 and is currently estimated at $584,426, approximately $367 per square foot. 15 Valley Dr is a home located in Bristol County with nearby schools including Mt. Hope High School, Highlander Charter Middle and High School, and Our Lady of Mt. Carmel School.
Ownership History
Date
Name
Owned For
Owner Type
Purchase Details
Closed on
Feb 28, 2013
Sold by
Costa Denise R
Bought by
Denise R Costa Lt and Costa Denise R
Current Estimated Value
Purchase Details
Closed on
Dec 9, 1998
Sold by
Quartrito Jerome J and Quartrito Michael A
Bought by
Costa Denise Rodriques
Home Financials for this Owner
Home Financials are based on the most recent Mortgage that was taken out on this home.
Original Mortgage
$114,400
Interest Rate
6.8%
Create a Home Valuation Report for This Property
The Home Valuation Report is an in-depth analysis detailing your home's value as well as a comparison with similar homes in the area
Home Values in the Area
Average Home Value in this Area
Purchase History
| Date | Buyer | Sale Price | Title Company |
|---|---|---|---|
| Denise R Costa Lt | -- | -- | |
| Costa Denise Rodriques | $143,000 | -- |
Source: Public Records
Mortgage History
| Date | Status | Borrower | Loan Amount |
|---|---|---|---|
| Open | Costa Denise Rodriques | $83,000 | |
| Previous Owner | Costa Denise Rodriques | $114,400 |
Source: Public Records
Tax History Compared to Growth
Tax History
| Year | Tax Paid | Tax Assessment Tax Assessment Total Assessment is a certain percentage of the fair market value that is determined by local assessors to be the total taxable value of land and additions on the property. | Land | Improvement |
|---|---|---|---|---|
| 2025 | $4,601 | $332,900 | $154,100 | $178,800 |
| 2024 | $4,601 | $332,900 | $154,100 | $178,800 |
| 2023 | $4,448 | $332,900 | $154,100 | $178,800 |
| 2022 | $4,328 | $332,900 | $154,100 | $178,800 |
| 2021 | $3,967 | $275,900 | $129,000 | $146,900 |
| 2020 | $3,882 | $275,900 | $129,000 | $146,900 |
| 2019 | $3,785 | $275,900 | $129,000 | $146,900 |
| 2018 | $4,317 | $280,700 | $126,900 | $153,800 |
| 2017 | $3,579 | $239,900 | $119,500 | $120,400 |
| 2016 | $3,543 | $239,900 | $119,500 | $120,400 |
| 2015 | $3,244 | $231,200 | $119,500 | $111,700 |
| 2014 | $3,200 | $245,020 | $120,500 | $124,520 |
Source: Public Records
Map
Nearby Homes