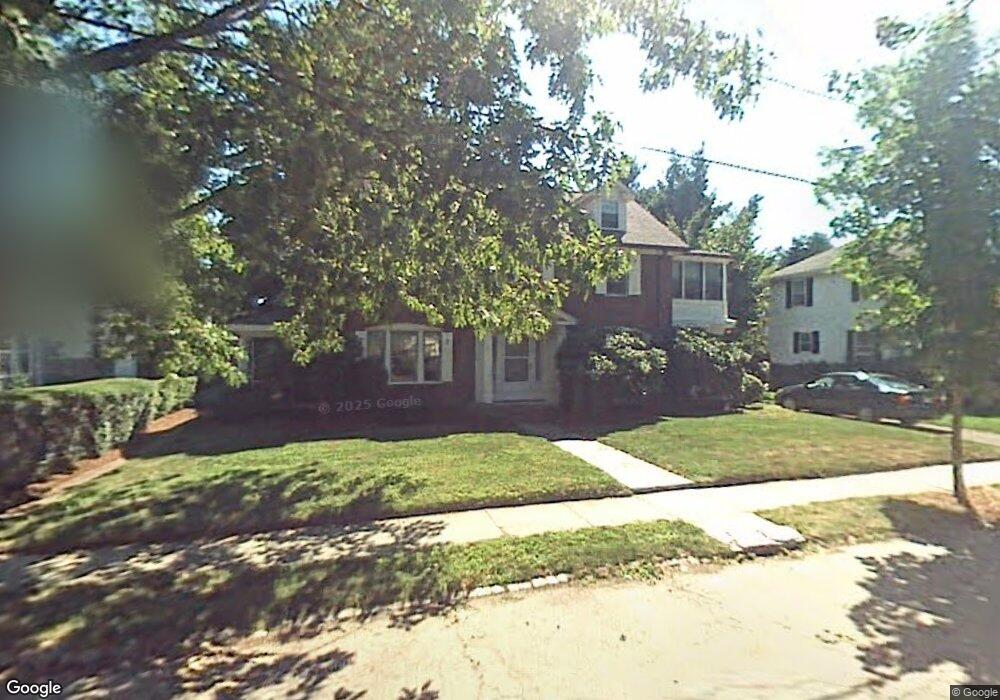
15 Van Ness Rd Belmont, MA 02478
Cushing Square NeighborhoodEstimated Value: $1,447,403 - $1,637,000
3
Beds
2
Baths
1,989
Sq Ft
$770/Sq Ft
Est. Value
About This Home
This home is located at 15 Van Ness Rd, Belmont, MA 02478 and is currently estimated at $1,532,351, approximately $770 per square foot. 15 Van Ness Rd is a home located in Middlesex County with nearby schools including Roger Wellington Elementary School, Winthrop L Chenery Middle School, and Belmont High School.
Ownership History
Date
Name
Owned For
Owner Type
Purchase Details
Closed on
Apr 27, 2012
Sold by
G & M Lp
Bought by
Kioumejian Pasqual and Kioumejian Mary T
Current Estimated Value
Home Financials for this Owner
Home Financials are based on the most recent Mortgage that was taken out on this home.
Original Mortgage
$465,470
Outstanding Balance
$322,652
Interest Rate
3.91%
Mortgage Type
New Conventional
Estimated Equity
$1,209,699
Create a Home Valuation Report for This Property
The Home Valuation Report is an in-depth analysis detailing your home's value as well as a comparison with similar homes in the area
Home Values in the Area
Average Home Value in this Area
Purchase History
| Date | Buyer | Sale Price | Title Company |
|---|---|---|---|
| Kioumejian Pasqual | $600,000 | -- |
Source: Public Records
Mortgage History
| Date | Status | Borrower | Loan Amount |
|---|---|---|---|
| Open | Kioumejian Pasqual | $465,470 |
Source: Public Records
Tax History Compared to Growth
Tax History
| Year | Tax Paid | Tax Assessment Tax Assessment Total Assessment is a certain percentage of the fair market value that is determined by local assessors to be the total taxable value of land and additions on the property. | Land | Improvement |
|---|---|---|---|---|
| 2025 | $15,730 | $1,381,000 | $754,000 | $627,000 |
| 2024 | $14,773 | $1,399,000 | $893,000 | $506,000 |
| 2023 | $14,668 | $1,305,000 | $843,000 | $462,000 |
| 2022 | $16,202 | $1,203,000 | $771,000 | $432,000 |
| 2021 | $16,202 | $1,404,000 | $964,000 | $440,000 |
| 2020 | $7,106 | $1,202,000 | $825,000 | $377,000 |
| 2019 | $11,227 | $962,000 | $624,000 | $338,000 |
| 2018 | $9,939 | $818,000 | $567,000 | $251,000 |
| 2017 | $6,461 | $750,000 | $499,000 | $251,000 |
| 2016 | $9,382 | $747,000 | $499,000 | $248,000 |
| 2015 | $8,733 | $677,000 | $429,000 | $248,000 |
Source: Public Records
Map
Nearby Homes
- 7 Pine St
- 276 Belmont St Unit 1
- 147 Langdon Ave Unit 147
- 147 Langdon Ave Unit 149
- 354 School St Unit 354
- 172 Maplewood St
- 456 Belmont St Unit 10
- 81 Winsor Ave
- 56-58 Edgecliff Rd
- 532 Belmont St
- 67-69 Berwick St
- 68 Payson Rd
- 79 Livermore Rd
- 30 Unity Ave Unit 30
- 15 Edgecliff Rd
- 11 Payson Rd Unit 11
- 5 Marlboro St
- 163 Belmont St
- 27 Appleton St
- 125 Trapelo Rd Unit 23