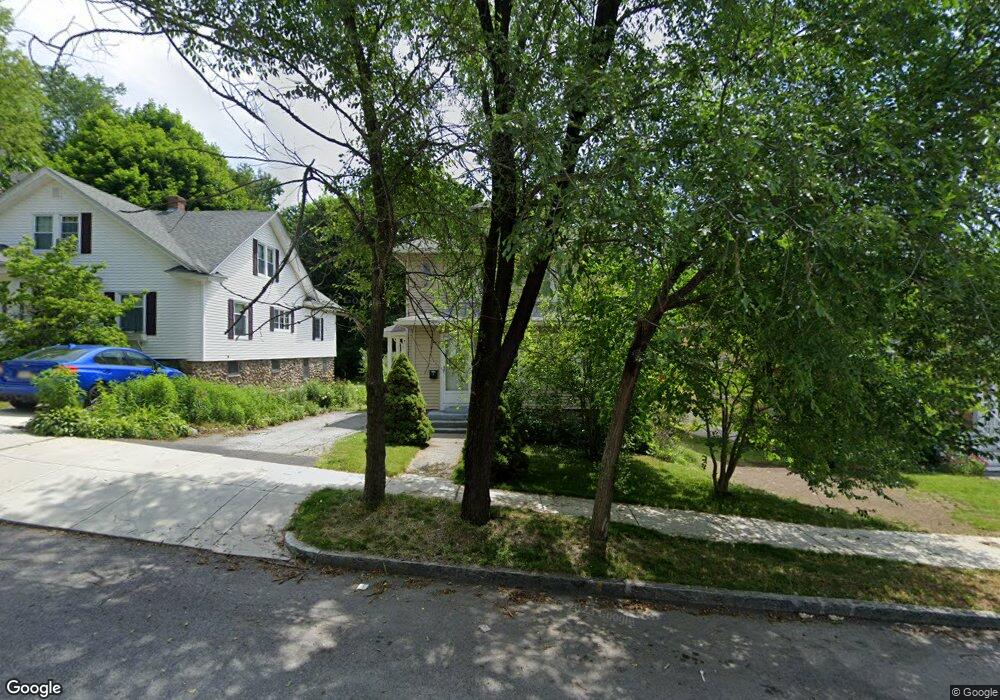
15 Vesper St Worcester, MA 01602
Newton Square NeighborhoodEstimated Value: $424,000 - $488,000
4
Beds
2
Baths
1,780
Sq Ft
$259/Sq Ft
Est. Value
About This Home
This home is located at 15 Vesper St, Worcester, MA 01602 and is currently estimated at $460,761, approximately $258 per square foot. 15 Vesper St is a home located in Worcester County with nearby schools including Tatnuck Magnet School, Chandler Magnet, and Jacob Hiatt Magnet School.
Ownership History
Date
Name
Owned For
Owner Type
Purchase Details
Closed on
Oct 21, 2005
Sold by
Zelayandia Fredy and Zelayandia Maria E
Bought by
Kebede Tegest
Current Estimated Value
Home Financials for this Owner
Home Financials are based on the most recent Mortgage that was taken out on this home.
Original Mortgage
$159,600
Outstanding Balance
$85,210
Interest Rate
5.72%
Mortgage Type
Purchase Money Mortgage
Estimated Equity
$375,551
Purchase Details
Closed on
Aug 29, 2003
Sold by
Kasakoff Elisabeth
Bought by
Zelayandia Fredy and Zelayandia Maria E
Home Financials for this Owner
Home Financials are based on the most recent Mortgage that was taken out on this home.
Original Mortgage
$172,900
Interest Rate
5.69%
Mortgage Type
Purchase Money Mortgage
Create a Home Valuation Report for This Property
The Home Valuation Report is an in-depth analysis detailing your home's value as well as a comparison with similar homes in the area
Home Values in the Area
Average Home Value in this Area
Purchase History
| Date | Buyer | Sale Price | Title Company |
|---|---|---|---|
| Kebede Tegest | $228,000 | -- | |
| Zelayandia Fredy | $182,000 | -- |
Source: Public Records
Mortgage History
| Date | Status | Borrower | Loan Amount |
|---|---|---|---|
| Open | Kebede Tegest | $159,600 | |
| Previous Owner | Zelayandia Fredy | $172,900 |
Source: Public Records
Tax History Compared to Growth
Tax History
| Year | Tax Paid | Tax Assessment Tax Assessment Total Assessment is a certain percentage of the fair market value that is determined by local assessors to be the total taxable value of land and additions on the property. | Land | Improvement |
|---|---|---|---|---|
| 2025 | $5,232 | $396,700 | $111,500 | $285,200 |
| 2024 | $5,001 | $363,700 | $111,500 | $252,200 |
| 2023 | $4,814 | $335,700 | $97,000 | $238,700 |
| 2022 | $4,446 | $292,300 | $77,600 | $214,700 |
| 2021 | $4,422 | $271,600 | $62,000 | $209,600 |
| 2020 | $4,202 | $247,200 | $62,100 | $185,100 |
| 2019 | $4,037 | $224,300 | $55,800 | $168,500 |
| 2018 | $4,028 | $213,000 | $55,800 | $157,200 |
| 2017 | $3,848 | $200,200 | $55,800 | $144,400 |
| 2016 | $3,860 | $187,300 | $41,600 | $145,700 |
| 2015 | $3,759 | $187,300 | $41,600 | $145,700 |
| 2014 | $3,660 | $187,300 | $41,600 | $145,700 |
Source: Public Records
Map
Nearby Homes
- 980 Pleasant St
- 40 Rustic Dr
- 57 Berwick St
- 22 Audubon Rd
- 1029 Pleasant St Unit 19
- 19 Kenilworth Rd
- 31 Lenox St
- 12 Merlin Ct
- 134 Richmond Ave
- 9 Field Way
- 20 Manhattan Rd
- 12 Copperfield Rd
- 806 Pleasant St
- 33 Aylesbury Rd
- 563 Chandler St
- 32 Aylesbury Rd
- 16 Sherwood Rd
- 5 Forest Hill Dr
- 42 Ellis Dr
- 9 Dennison Rd