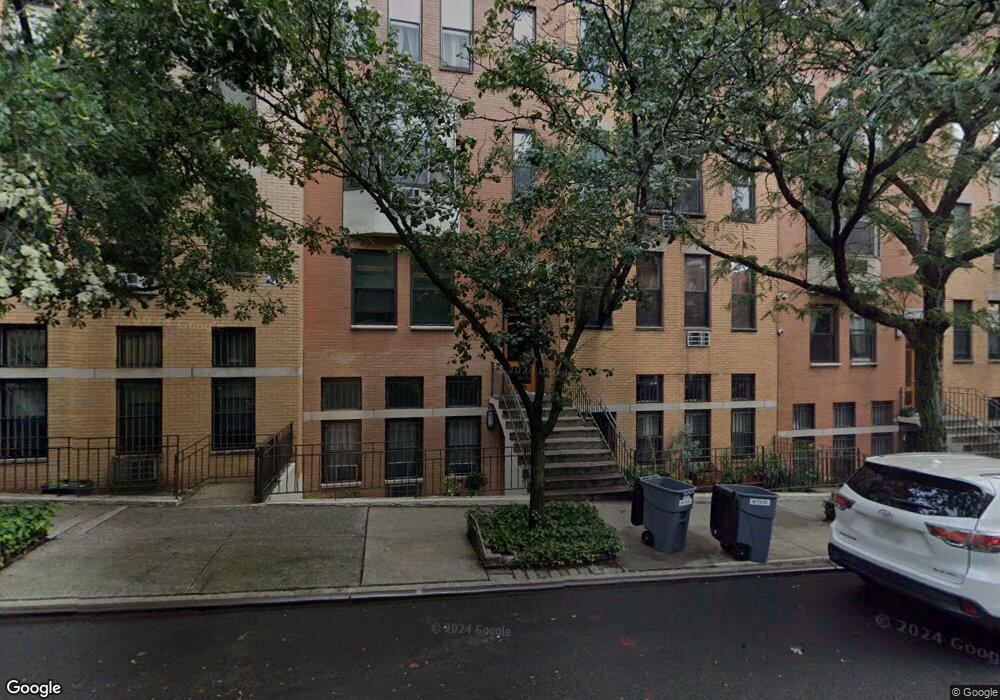
15 W 104th St Unit 21 New York, NY 10025
Manhattan Valley NeighborhoodEstimated Value: $978,000 - $1,295,000
--
Bed
--
Bath
1,162
Sq Ft
$989/Sq Ft
Est. Value
About This Home
This home is located at 15 W 104th St Unit 21, New York, NY 10025 and is currently estimated at $1,149,758, approximately $989 per square foot. 15 W 104th St Unit 21 is a home located in New York County with nearby schools including The Ps 145 Bloomingdale School and Solomon Schechter School of Manhattan.
Ownership History
Date
Name
Owned For
Owner Type
Purchase Details
Closed on
May 15, 2025
Sold by
Sun Wanyu
Bought by
Valour Holdings Llc
Current Estimated Value
Purchase Details
Closed on
Sep 9, 2024
Sold by
Huang Yenchen and Sun Wanyu
Bought by
Sun Wanyu
Purchase Details
Closed on
Nov 12, 2010
Sold by
Lee Kevin J and Vosshall Leslie B
Bought by
Huang Yenchen and Sin Wanyu
Purchase Details
Closed on
Oct 17, 2001
Sold by
Cornell Barbara and Simpson Ian
Bought by
Lee Kevin J and Vosshall Leslie B
Home Financials for this Owner
Home Financials are based on the most recent Mortgage that was taken out on this home.
Original Mortgage
$400,000
Interest Rate
6.7%
Mortgage Type
Purchase Money Mortgage
Purchase Details
Closed on
Oct 12, 1999
Sold by
Cammon Homer
Bought by
Simpson Ian and Cornell Barbara
Home Financials for this Owner
Home Financials are based on the most recent Mortgage that was taken out on this home.
Original Mortgage
$160,000
Interest Rate
7.61%
Create a Home Valuation Report for This Property
The Home Valuation Report is an in-depth analysis detailing your home's value as well as a comparison with similar homes in the area
Home Values in the Area
Average Home Value in this Area
Purchase History
| Date | Buyer | Sale Price | Title Company |
|---|---|---|---|
| Valour Holdings Llc | -- | -- | |
| Sun Wanyu | -- | -- | |
| Huang Yenchen | $760,000 | -- | |
| Huang Yenchen | $760,000 | -- | |
| Lee Kevin J | -- | -- | |
| Lee Kevin J | -- | -- | |
| Simpson Ian | $220,000 | Chicago Title | |
| Simpson Ian | $220,000 | Chicago Title |
Source: Public Records
Mortgage History
| Date | Status | Borrower | Loan Amount |
|---|---|---|---|
| Previous Owner | Lee Kevin J | $400,000 | |
| Previous Owner | Simpson Ian | $160,000 |
Source: Public Records
Tax History Compared to Growth
Tax History
| Year | Tax Paid | Tax Assessment Tax Assessment Total Assessment is a certain percentage of the fair market value that is determined by local assessors to be the total taxable value of land and additions on the property. | Land | Improvement |
|---|---|---|---|---|
| 2025 | $11,672 | $91,563 | $18,975 | $72,588 |
| 2024 | $11,672 | $93,365 | $18,975 | $74,390 |
| 2023 | $11,485 | $93,627 | $18,975 | $74,652 |
| 2022 | $9,142 | $90,802 | $18,975 | $71,827 |
| 2021 | $10,836 | $89,396 | $18,975 | $70,421 |
| 2020 | $8,553 | $95,965 | $18,975 | $76,990 |
| 2019 | $7,927 | $92,258 | $18,975 | $73,283 |
| 2018 | $8,899 | $89,038 | $18,975 | $70,063 |
| 2017 | $8,056 | $75,004 | $18,975 | $56,029 |
| 2016 | $7,682 | $66,147 | $18,975 | $47,172 |
| 2015 | $4,672 | $61,465 | $18,976 | $42,489 |
| 2014 | $4,672 | $58,187 | $18,975 | $39,212 |
Source: Public Records
Map
Nearby Homes
- 44 W 105th St Unit 1A
- 4-6 W 105th St Unit 6
- 4 W 105th St Unit 6
- 4 W 105th St Unit 3F
- 444 Central Park W Unit 10D
- 444 Central Park W Unit 1 F
- 58 W 105th St Unit 5 A
- 133 Manhattan Ave
- 138 Manhattan Ave
- 455 Central Park W Unit 11
- 50 W 106th St Unit 15-A
- 58 W 106th St Unit 5A
- 425 Central Park W Unit 3J
- 420 Central Park W Unit 2B
- 418 Central Park W Unit 54
- 418 Central Park W Unit 22
- 467 Central Park W Unit 1D
- 467 Central Park W Unit 14B
- 415 Central Park W Unit 8D
- 415 Central Park W Unit 6A
- 15 W 104th St Unit 24
- 15 W 104th St Unit 23
- 15 W 104th St Unit 22
- 15 W 104th St Unit 20
- 15 W 104th St Unit 19
- 15 W 104th St Unit 18
- 15 W 104th St Unit 17
- 15 W 104th St Unit 4 B
- 15 W 104th St Unit 3B
- 15 W 104th St Unit 2-B
- 15 W 104th St Unit 1-B
- 19 W 104th St Unit 27
- 19 W 104th St Unit 25
- 19 W 104th St Unit 4
- 11 W 104th St Unit 16
- 11 W 104th St Unit 15
- 11 W 104th St Unit 14
- 11 W 104th St Unit 13
- 11 W 104th St Unit 12
- 11 W 104th St Unit 2B48