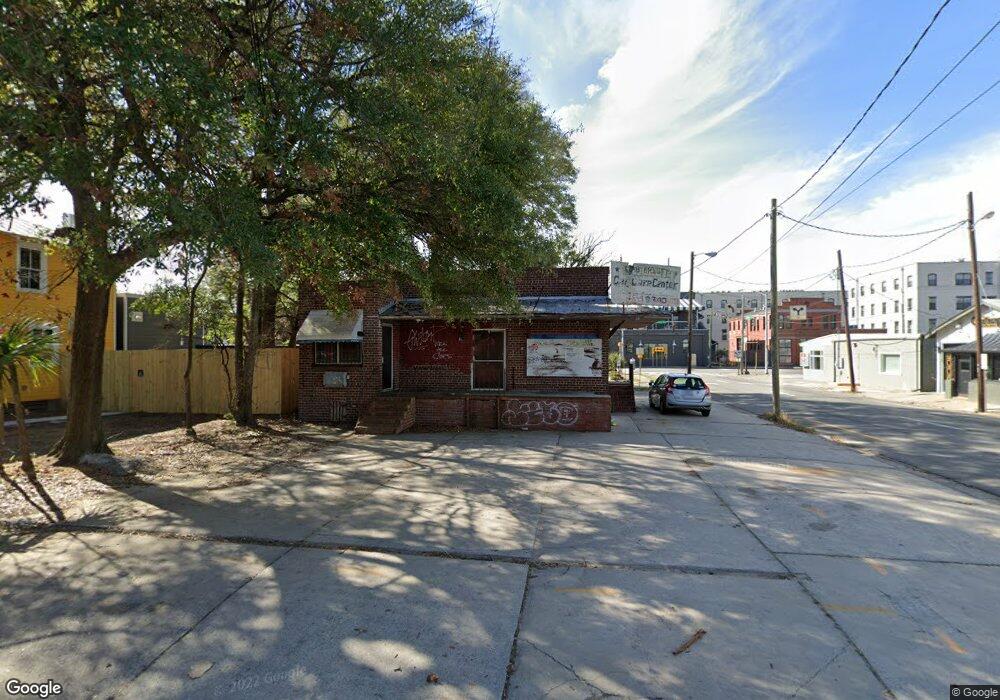
15 W 43rd St Savannah, GA 31401
Metropolitan NeighborhoodEstimated Value: $421,561
--
Bed
--
Bath
1,020
Sq Ft
$413/Sq Ft
Est. Value
About This Home
This home is located at 15 W 43rd St, Savannah, GA 31401 and is currently priced at $421,561, approximately $413 per square foot. 15 W 43rd St is a home located in Chatham County with nearby schools including Derenne Middle School, Beach High School, and Susie King Taylor Community School.
Ownership History
Date
Name
Owned For
Owner Type
Purchase Details
Closed on
Dec 1, 2021
Sold by
Kimball Terry Michael
Bought by
15 West 43Rd Street Llc
Current Estimated Value
Home Financials for this Owner
Home Financials are based on the most recent Mortgage that was taken out on this home.
Original Mortgage
$550,000
Interest Rate
3.09%
Mortgage Type
Commercial
Purchase Details
Closed on
Nov 23, 2021
Sold by
Kimball Barbara Ann Howe
Bought by
Kimball Terry Michael and Kimball Scott Andrew
Home Financials for this Owner
Home Financials are based on the most recent Mortgage that was taken out on this home.
Original Mortgage
$550,000
Interest Rate
3.09%
Mortgage Type
Commercial
Create a Home Valuation Report for This Property
The Home Valuation Report is an in-depth analysis detailing your home's value as well as a comparison with similar homes in the area
Home Values in the Area
Average Home Value in this Area
Purchase History
| Date | Buyer | Sale Price | Title Company |
|---|---|---|---|
| 15 West 43Rd Street Llc | $332,100 | -- | |
| Kimball Terry Michael | -- | -- |
Source: Public Records
Mortgage History
| Date | Status | Borrower | Loan Amount |
|---|---|---|---|
| Closed | 15 West 43Rd Street Llc | $550,000 |
Source: Public Records
Tax History Compared to Growth
Tax History
| Year | Tax Paid | Tax Assessment Tax Assessment Total Assessment is a certain percentage of the fair market value that is determined by local assessors to be the total taxable value of land and additions on the property. | Land | Improvement |
|---|---|---|---|---|
| 2025 | $3,080 | $53,160 | $43,200 | $9,960 |
| 2024 | $3,080 | $53,000 | $43,200 | $9,800 |
| 2023 | $649 | $53,200 | $43,200 | $10,000 |
| 2022 | $631 | $51,680 | $43,200 | $8,480 |
| 2021 | $2,457 | $50,520 | $43,200 | $7,320 |
| 2020 | $922 | $33,080 | $25,920 | $7,160 |
| 2019 | $1,754 | $29,200 | $23,320 | $5,880 |
| 2018 | $1,301 | $28,920 | $23,320 | $5,600 |
| 2017 | $1,200 | $28,840 | $23,320 | $5,520 |
| 2016 | $840 | $28,800 | $23,320 | $5,480 |
| 2015 | $1,203 | $28,840 | $23,320 | $5,520 |
| 2014 | $1,598 | $28,800 | $0 | $0 |
Source: Public Records
Map
Nearby Homes
- 0 E Victory Dr Unit SA342445
- 216 W 43rd St
- 2406 De Soto Ave Unit B
- 116 Pearl St
- 118 Pearl St
- 310 W 42nd St
- 221 W 39th St
- 303 W 39th St
- 420 W 42nd St
- 111 E 39th St
- 34 Washington Ave
- 121 E Victory Dr
- 501 W 42nd St
- 503 W 42nd St
- 218 W 38th St
- 102 E 38th St
- 309 E 41st St
- 110 E 38th St
- 302 W 38th St
- 306 W 38th St
- 11 W 43rd St
- 9 W 43rd St
- 10 W Victory Dr
- 5 W 43rd St
- 2603 Whitaker St
- 2602 Whitaker St
- 14 W 43rd St
- 2601 Bull St
- 2514 Whitaker St
- 2424 De Soto Ave
- 113 W 42nd St
- 2602 Barnard St
- 108 W 42nd St
- 2517 Bull St
- 2517 Bull St Unit E
- 2517 Bull St Unit C
- 2517 Bull St Unit F
- 2517 Bull St Unit G
- 2517 Bull St Unit B
- 2517 Bull St Unit A