Estimated Value: $188,000 - $197,000
3
Beds
3
Baths
1,238
Sq Ft
$155/Sq Ft
Est. Value
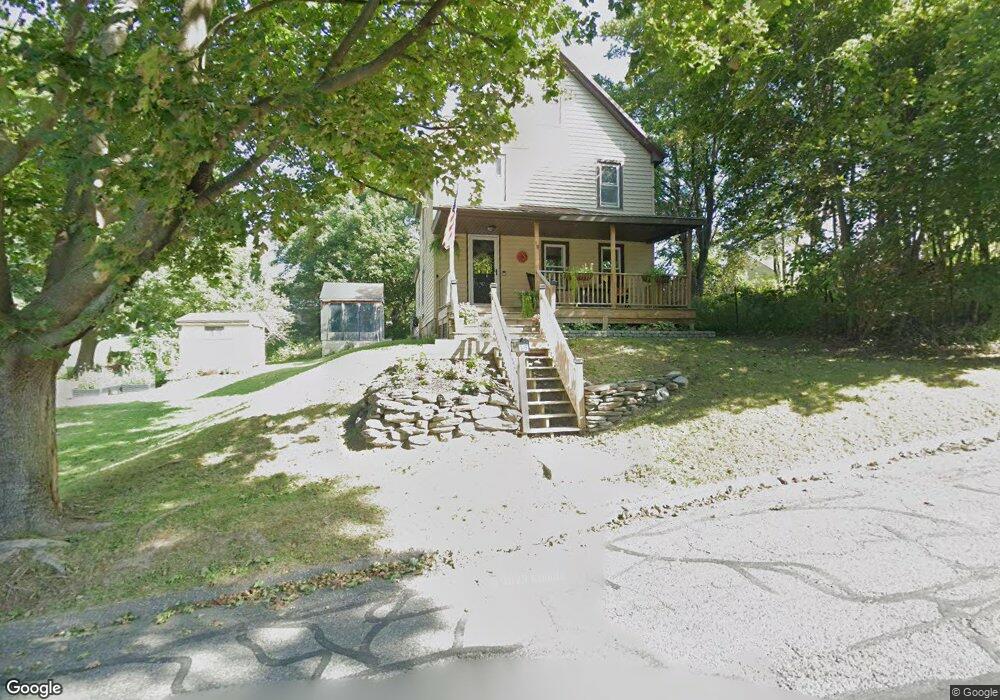
About This Home
This home is located at 15 Walnut St, Adams, MA 01220 and is currently estimated at $192,174, approximately $155 per square foot. 15 Walnut St is a home located in Berkshire County with nearby schools including Hoosac Valley Middle & High School, Berkshire Arts & Technology Charter Public School, and St. Stanislaus Kostka School.
Ownership History
Date
Name
Owned For
Owner Type
Purchase Details
Closed on
Oct 11, 2023
Sold by
Schaffrick John A
Bought by
Brown-Wood Kayla M
Current Estimated Value
Home Financials for this Owner
Home Financials are based on the most recent Mortgage that was taken out on this home.
Original Mortgage
$134,850
Outstanding Balance
$132,228
Interest Rate
7.18%
Mortgage Type
Purchase Money Mortgage
Estimated Equity
$59,946
Purchase Details
Closed on
Nov 27, 1996
Sold by
Shaw Steven and Shaw Eleanor A
Bought by
Schaffrick John A
Purchase Details
Closed on
Jan 5, 1988
Sold by
Shaw Eleanor A
Bought by
Shaw Steven
Create a Home Valuation Report for This Property
The Home Valuation Report is an in-depth analysis detailing your home's value as well as a comparison with similar homes in the area
Home Values in the Area
Average Home Value in this Area
Purchase History
| Date | Buyer | Sale Price | Title Company |
|---|---|---|---|
| Brown-Wood Kayla M | $150,000 | None Available | |
| Brown-Wood Kayla M | $150,000 | None Available | |
| Schaffrick John A | $40,000 | -- | |
| Schaffrick John A | $40,000 | -- | |
| Shaw Steven | $10,000 | -- |
Source: Public Records
Mortgage History
| Date | Status | Borrower | Loan Amount |
|---|---|---|---|
| Open | Brown-Wood Kayla M | $134,850 | |
| Closed | Brown-Wood Kayla M | $134,850 | |
| Previous Owner | Shaw Steven | $182,000 | |
| Previous Owner | Shaw Steven | $106,000 |
Source: Public Records
Tax History
| Year | Tax Paid | Tax Assessment Tax Assessment Total Assessment is a certain percentage of the fair market value that is determined by local assessors to be the total taxable value of land and additions on the property. | Land | Improvement |
|---|---|---|---|---|
| 2025 | $2,390 | $140,500 | $53,800 | $86,700 |
| 2024 | $2,266 | $129,200 | $50,600 | $78,600 |
| 2023 | $2,124 | $114,500 | $46,000 | $68,500 |
| 2022 | $2,072 | $99,200 | $40,000 | $59,200 |
| 2021 | $5,038 | $91,700 | $40,000 | $51,700 |
| 2020 | $1,583 | $90,300 | $40,000 | $50,300 |
| 2019 | $1,932 | $90,300 | $40,000 | $50,300 |
| 2018 | $1,986 | $89,400 | $40,000 | $49,400 |
| 2017 | $1,910 | $89,400 | $40,000 | $49,400 |
| 2016 | $1,555 | $72,700 | $40,000 | $32,700 |
| 2015 | $1,558 | $72,900 | $41,800 | $31,100 |
| 2014 | $1,454 | $72,900 | $41,800 | $31,100 |
Source: Public Records
Map
Nearby Homes
Your Personal Tour Guide
Ask me questions while you tour the home.