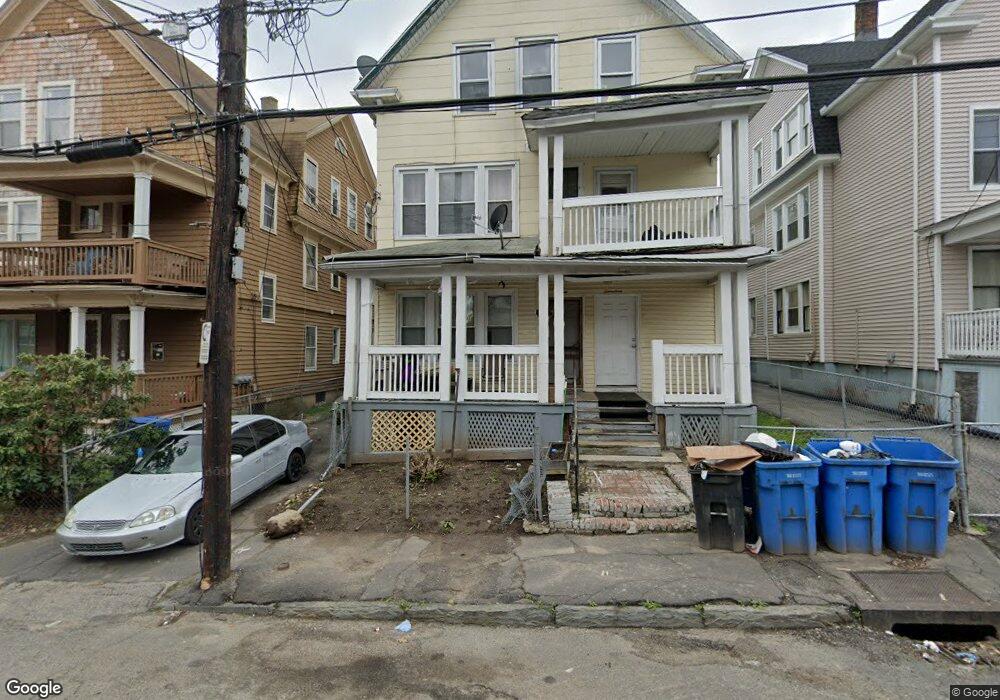
15 Waterville St Waterbury, CT 06710
Village of Waterbury NeighborhoodEstimated Value: $320,000 - $400,000
11
Beds
3
Baths
3,369
Sq Ft
$108/Sq Ft
Est. Value
About This Home
This home is located at 15 Waterville St, Waterbury, CT 06710 and is currently estimated at $363,667, approximately $107 per square foot. 15 Waterville St is a home located in New Haven County with nearby schools including North End Middle School and Wilby High School.
Ownership History
Date
Name
Owned For
Owner Type
Purchase Details
Closed on
Oct 24, 2022
Sold by
Patriot Apartments Llc
Bought by
37 Units Mazel Llc
Current Estimated Value
Home Financials for this Owner
Home Financials are based on the most recent Mortgage that was taken out on this home.
Original Mortgage
$1,767,500
Outstanding Balance
$1,710,600
Interest Rate
6.92%
Mortgage Type
Commercial
Estimated Equity
-$1,346,933
Purchase Details
Closed on
Feb 23, 2009
Sold by
Us Bank Na
Bought by
Veldare Llc
Purchase Details
Closed on
Sep 20, 2006
Sold by
Invernat Llc
Bought by
Lubanda Aleta
Home Financials for this Owner
Home Financials are based on the most recent Mortgage that was taken out on this home.
Original Mortgage
$197,250
Interest Rate
6.59%
Mortgage Type
Purchase Money Mortgage
Purchase Details
Closed on
Apr 29, 2002
Sold by
M & B Realty Inv Llc
Bought by
Mejias Brenda L
Purchase Details
Closed on
Jan 29, 2002
Sold by
Bankers Trust Co
Bought by
M & B Realty Inv
Create a Home Valuation Report for This Property
The Home Valuation Report is an in-depth analysis detailing your home's value as well as a comparison with similar homes in the area
Home Values in the Area
Average Home Value in this Area
Purchase History
| Date | Buyer | Sale Price | Title Company |
|---|---|---|---|
| 37 Units Mazel Llc | $250,000 | None Available | |
| Veldare Llc | $26,100 | -- | |
| Lubanda Aleta | $263,000 | -- | |
| Mejias Brenda L | $89,900 | -- | |
| M & B Realty Inv | $19,000 | -- |
Source: Public Records
Mortgage History
| Date | Status | Borrower | Loan Amount |
|---|---|---|---|
| Open | 37 Units Mazel Llc | $1,767,500 | |
| Previous Owner | M & B Realty Inv | $434,000 | |
| Previous Owner | M & B Realty Inv | $197,250 |
Source: Public Records
Tax History Compared to Growth
Tax History
| Year | Tax Paid | Tax Assessment Tax Assessment Total Assessment is a certain percentage of the fair market value that is determined by local assessors to be the total taxable value of land and additions on the property. | Land | Improvement |
|---|---|---|---|---|
| 2025 | $3,734 | $83,020 | $6,930 | $76,090 |
| 2024 | $4,105 | $83,020 | $6,930 | $76,090 |
| 2023 | $4,499 | $83,020 | $6,930 | $76,090 |
| 2022 | $2,550 | $42,350 | $6,930 | $35,420 |
| 2021 | $2,550 | $42,350 | $6,930 | $35,420 |
| 2020 | $2,550 | $42,350 | $6,930 | $35,420 |
| 2019 | $2,550 | $42,350 | $6,930 | $35,420 |
| 2018 | $2,550 | $42,350 | $6,930 | $35,420 |
| 2017 | $2,587 | $42,970 | $6,930 | $36,040 |
| 2016 | $2,587 | $42,970 | $6,930 | $36,040 |
| 2015 | $2,502 | $42,970 | $6,930 | $36,040 |
| 2014 | $2,502 | $42,970 | $6,930 | $36,040 |
Source: Public Records
Map
Nearby Homes
- 15 Waterville St Unit 3FL
- 15 Waterville St Unit 1FL
- 15 Waterville St Unit 2FL
- 19 Waterville St
- 19 Waterville St Unit 1
- 11 Waterville St
- 23 Waterville St
- 29 Waterville St Unit 3
- 29 Waterville St Unit 2
- 14 Waterville St
- 27 Waterville St
- 18 Waterville St
- 18 Waterville St Unit 2nd
- 18 Waterville St Unit 1FL
- 18 Waterville St Unit 2FL
- 18 Waterville St Unit 3FL
- 55 Waterville St
- 6 Waterville St
- 26 Waterville St Unit 2