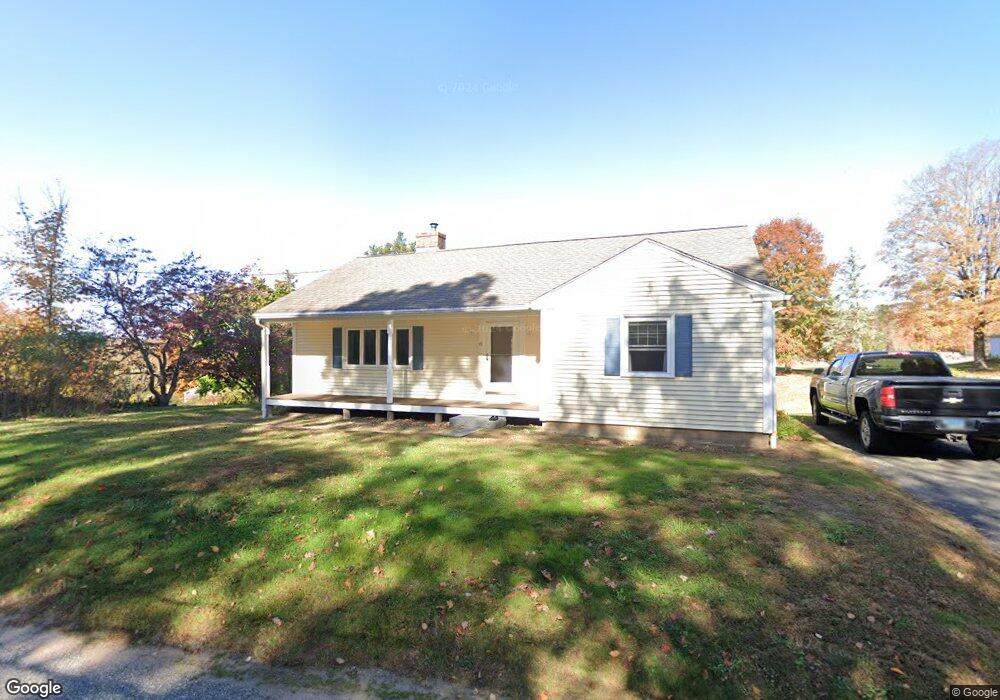
15 Wigwam Rd Moodus, CT 06469
Estimated Value: $180,000 - $385,000
3
Beds
2
Baths
1,305
Sq Ft
$225/Sq Ft
Est. Value
About This Home
This home is located at 15 Wigwam Rd, Moodus, CT 06469 and is currently estimated at $293,918, approximately $225 per square foot. 15 Wigwam Rd is a home located in Middlesex County with nearby schools including East Haddam Elementary School, Nathan Hale-Ray Middle School, and Nathan Hale-Ray High School.
Ownership History
Date
Name
Owned For
Owner Type
Purchase Details
Closed on
Feb 4, 2021
Sold by
Shea Francis A and Shea Richard A
Bought by
Shea Richard A
Current Estimated Value
Purchase Details
Closed on
Nov 18, 1998
Sold by
Standish Mary Ann
Bought by
Shea Richard A
Create a Home Valuation Report for This Property
The Home Valuation Report is an in-depth analysis detailing your home's value as well as a comparison with similar homes in the area
Home Values in the Area
Average Home Value in this Area
Purchase History
| Date | Buyer | Sale Price | Title Company |
|---|---|---|---|
| Shea Richard A | -- | None Available | |
| Shea Richard A | $40,000 | -- |
Source: Public Records
Mortgage History
| Date | Status | Borrower | Loan Amount |
|---|---|---|---|
| Previous Owner | Shea Richard A | $100,000 | |
| Previous Owner | Shea Richard A | $75,000 | |
| Previous Owner | Shea Richard A | $65,000 |
Source: Public Records
Tax History Compared to Growth
Tax History
| Year | Tax Paid | Tax Assessment Tax Assessment Total Assessment is a certain percentage of the fair market value that is determined by local assessors to be the total taxable value of land and additions on the property. | Land | Improvement |
|---|---|---|---|---|
| 2025 | $4,468 | $159,240 | $60,540 | $98,700 |
| 2024 | $4,261 | $159,240 | $60,540 | $98,700 |
| 2023 | $4,100 | $159,240 | $60,540 | $98,700 |
| 2022 | $3,908 | $122,920 | $43,120 | $79,800 |
| 2021 | $3,742 | $122,920 | $43,120 | $79,800 |
| 2020 | $3,742 | $122,920 | $43,120 | $79,800 |
| 2019 | $3,742 | $122,920 | $43,120 | $79,800 |
| 2018 | $3,646 | $122,920 | $43,120 | $79,800 |
| 2017 | $3,392 | $114,660 | $43,120 | $71,540 |
| 2016 | $3,365 | $114,660 | $43,120 | $71,540 |
| 2015 | $3,288 | $114,660 | $43,120 | $71,540 |
| 2014 | $3,199 | $114,660 | $43,120 | $71,540 |
Source: Public Records
Map
Nearby Homes
- 5 Joe Williams Rd
- 4 Valley Brook Rd
- 67 Moodus Leesville Rd
- 53 Falls Rd
- 8 Augusta Cir Unit 8
- 80 Orchard Rd
- 53 Falls Bashan Rd
- 0 White Sands Rd
- 66 Falls Bashan Rd
- 154 Falls Rd
- 90 Falls Bashan Rd
- 10 Cherry Swamp Rd
- 2 Morgan Ln
- 1 Geronimo Rd
- 55 Bogel Rd
- 8 Tom Rd
- 42 Dogwood Rd
- 00 Mount Parnassus Rd
- 114 Lakeside Dr
- 16 Mount Parnassus Rd
- 17 Wigwam Rd
- 21 Wigwam Rd
- 9 Wigwam Rd
- 12 Wigwam Rd
- 23 Wigwam Rd
- 8 Wigwam Rd
- 26 Wigwam Rd Unit D
- 26 Wigwam Rd
- 26 Wigwam Rd Unit B
- 26 Wigwam Rd Unit A
- 23 North Ave
- 14 Wigwam Rd
- 19 North Ave
- 384 E Haddam Moodus Rd
- 617 Town St
- 331 Eh Moodus Rd
- 386 E Haddam Moodus Rd
- 380 E Haddam Moodus Rd
- 388 E Haddam Moodus Rd
- 394 E Haddam Moodus Rd