15 Wilson Rd Marshfield, MA 02050
Ocean Bluff-Brant Rock NeighborhoodEstimated Value: $470,000 - $525,361
2
Beds
1
Bath
696
Sq Ft
$715/Sq Ft
Est. Value
About This Home
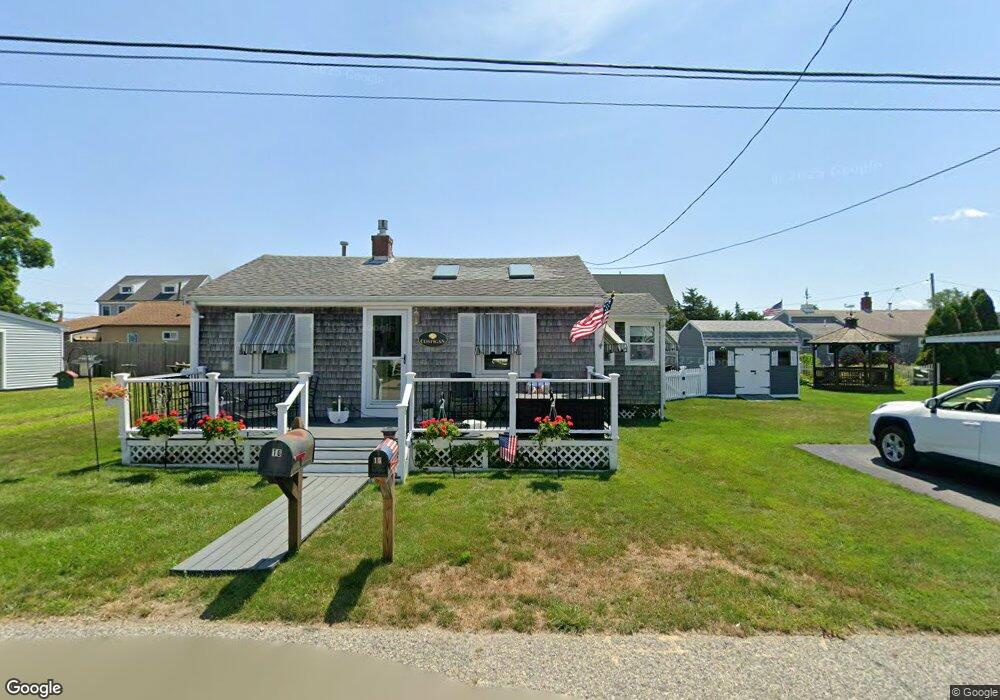
This home is located at 15 Wilson Rd, Marshfield, MA 02050 and is currently estimated at $497,590, approximately $714 per square foot. 15 Wilson Rd is a home located in Plymouth County with nearby schools including Daniel Webster, Furnace Brook Middle School, and Marshfield High School.
Ownership History
Date
Name
Owned For
Owner Type
Purchase Details
Closed on
Jan 17, 2017
Sold by
15 Wilson Road Rt and Gentile
Bought by
Costigan Susanne M
Current Estimated Value
Purchase Details
Closed on
May 6, 2008
Sold by
Gentile Patricia A
Bought by
15 Wilson Road Rt
Purchase Details
Closed on
Sep 17, 2007
Sold by
Costigan Edward J and Costigan Susanne M
Bought by
Costigan Susanne M
Create a Home Valuation Report for This Property
The Home Valuation Report is an in-depth analysis detailing your home's value as well as a comparison with similar homes in the area
Home Values in the Area
Average Home Value in this Area
Purchase History
| Date | Buyer | Sale Price | Title Company |
|---|---|---|---|
| Costigan Susanne M | -- | -- | |
| Costigan Susanne M | -- | -- | |
| 15 Wilson Road Rt | -- | -- | |
| Gentile Patricia A | -- | -- | |
| Gentile Patricia A | -- | -- | |
| Costigan Susanne M | -- | -- | |
| Costigan Susanne M | -- | -- |
Source: Public Records
Mortgage History
| Date | Status | Borrower | Loan Amount |
|---|---|---|---|
| Previous Owner | Costigan Susanne M | $292,000 | |
| Previous Owner | Costigan Susanne M | $200,000 |
Source: Public Records
Tax History
| Year | Tax Paid | Tax Assessment Tax Assessment Total Assessment is a certain percentage of the fair market value that is determined by local assessors to be the total taxable value of land and additions on the property. | Land | Improvement |
|---|---|---|---|---|
| 2025 | $4,551 | $459,700 | $317,700 | $142,000 |
| 2024 | $4,259 | $409,900 | $297,900 | $112,000 |
| 2023 | $4,057 | $369,400 | $268,100 | $101,300 |
| 2022 | $4,057 | $313,300 | $228,400 | $84,900 |
| 2021 | $3,921 | $297,300 | $218,400 | $78,900 |
| 2020 | $3,547 | $266,100 | $188,600 | $77,500 |
| 2019 | $3,461 | $258,700 | $188,600 | $70,100 |
| 2018 | $3,432 | $256,700 | $188,600 | $68,100 |
| 2017 | $3,330 | $242,700 | $178,700 | $64,000 |
| 2016 | $3,158 | $227,500 | $168,800 | $58,700 |
| 2015 | $2,969 | $223,400 | $168,800 | $54,600 |
| 2014 | $2,994 | $225,300 | $168,800 | $56,500 |
Source: Public Records
Map
Nearby Homes
- 85 Constitution Rd
- 122 June St
- 32 Gratto Rd
- 78 Tower Ave
- 155 Quincy Ave
- 17 Dyke Rd
- 30 Chandler Dr
- 106 Careswell St
- 116 Island St
- 42 Carr Rd
- 7 Pierce Rd
- 1192 S River St
- 92 Salt Meadow Waye
- 255 Ridge Rd
- 116 Outlook Rd
- 39 High Beacon Way
- 86 Telegraph Hill Rd
- 16 Schooner Way
- 86 Barouche Dr
- 290 S River St
Your Personal Tour Guide
Ask me questions while you tour the home.