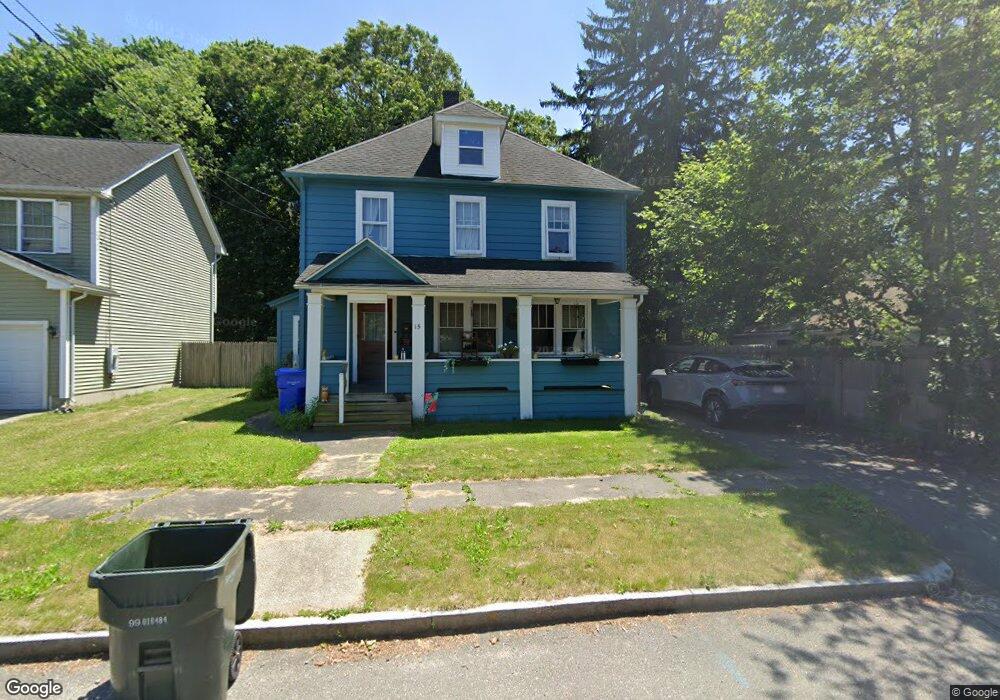
15 Wing St Indian Orchard, MA 01151
Indian Orchard NeighborhoodEstimated Value: $270,558 - $290,000
3
Beds
1
Bath
1,440
Sq Ft
$196/Sq Ft
Est. Value
About This Home
This home is located at 15 Wing St, Indian Orchard, MA 01151 and is currently estimated at $282,140, approximately $195 per square foot. 15 Wing St is a home located in Hampden County with nearby schools including Indian Orchard Elementary School, John F. Kennedy Academy, and Roger L. Putnam Vocational Technical Academy.
Ownership History
Date
Name
Owned For
Owner Type
Purchase Details
Closed on
May 28, 2010
Sold by
Czaplicki Stanley
Bought by
Quesenberry Denise Y
Current Estimated Value
Home Financials for this Owner
Home Financials are based on the most recent Mortgage that was taken out on this home.
Original Mortgage
$117,925
Outstanding Balance
$78,645
Interest Rate
4.87%
Mortgage Type
FHA
Estimated Equity
$203,495
Purchase Details
Closed on
Sep 4, 2009
Sold by
Przybycien Emily C
Bought by
Czaplicki Stanley
Create a Home Valuation Report for This Property
The Home Valuation Report is an in-depth analysis detailing your home's value as well as a comparison with similar homes in the area
Home Values in the Area
Average Home Value in this Area
Purchase History
| Date | Buyer | Sale Price | Title Company |
|---|---|---|---|
| Quesenberry Denise Y | $124,900 | -- | |
| Czaplicki Stanley | $105,000 | -- |
Source: Public Records
Mortgage History
| Date | Status | Borrower | Loan Amount |
|---|---|---|---|
| Open | Quesenberry Denise Y | $117,925 |
Source: Public Records
Tax History Compared to Growth
Tax History
| Year | Tax Paid | Tax Assessment Tax Assessment Total Assessment is a certain percentage of the fair market value that is determined by local assessors to be the total taxable value of land and additions on the property. | Land | Improvement |
|---|---|---|---|---|
| 2025 | $3,575 | $228,000 | $43,000 | $185,000 |
| 2024 | $3,019 | $188,000 | $40,200 | $147,800 |
| 2023 | $2,996 | $175,700 | $32,900 | $142,800 |
| 2022 | $2,855 | $151,700 | $30,800 | $120,900 |
| 2021 | $2,767 | $146,400 | $28,000 | $118,400 |
| 2020 | $2,650 | $135,700 | $28,000 | $107,700 |
| 2019 | $2,547 | $129,400 | $29,000 | $100,400 |
| 2018 | $2,401 | $122,000 | $29,000 | $93,000 |
| 2017 | $2,300 | $117,000 | $24,700 | $92,300 |
| 2016 | $2,056 | $104,600 | $24,700 | $79,900 |
| 2015 | $2,077 | $105,600 | $24,700 | $80,900 |
Source: Public Records
Map
Nearby Homes