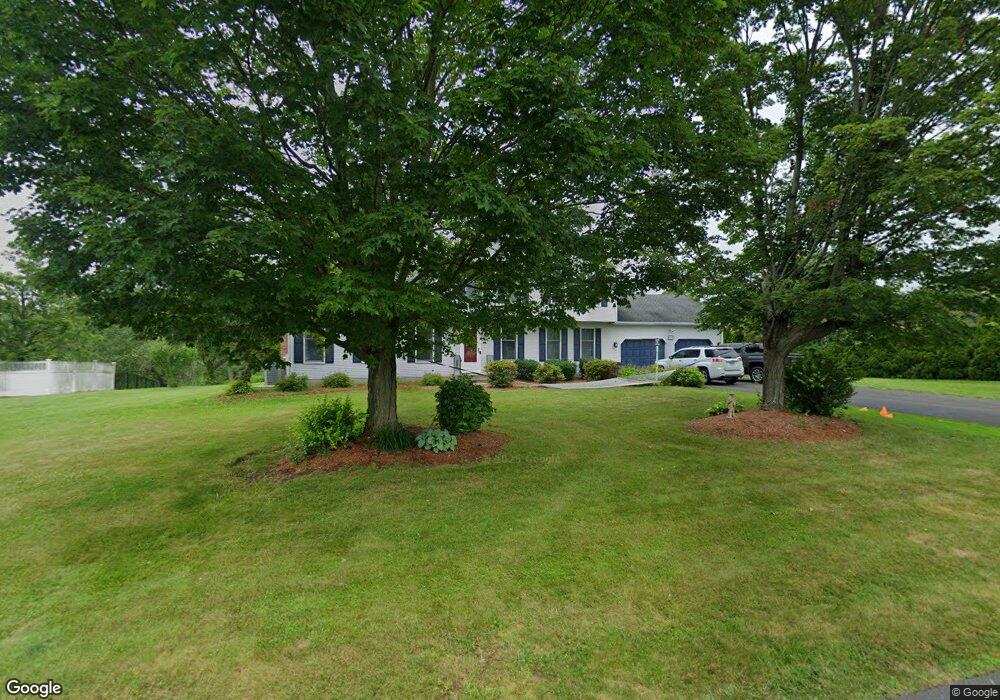
15 Wren Rd Suffield, CT 06078
Estimated Value: $603,600 - $690,000
3
Beds
3
Baths
2,432
Sq Ft
$264/Sq Ft
Est. Value
About This Home
This home is located at 15 Wren Rd, Suffield, CT 06078 and is currently estimated at $641,400, approximately $263 per square foot. 15 Wren Rd is a home located in Hartford County with nearby schools including A. Ward Spaulding School, Mcalister Intermediate School, and Suffield Middle School.
Ownership History
Date
Name
Owned For
Owner Type
Purchase Details
Closed on
May 3, 2018
Sold by
Demur David and Roszczewski Catherine
Bought by
Demur David and Demur William
Current Estimated Value
Home Financials for this Owner
Home Financials are based on the most recent Mortgage that was taken out on this home.
Original Mortgage
$285,180
Outstanding Balance
$245,832
Interest Rate
4.45%
Mortgage Type
Credit Line Revolving
Estimated Equity
$395,568
Purchase Details
Closed on
May 20, 2015
Sold by
Demur Cynthia L and Miller Robin B
Bought by
Demur David and Roszczewski Catherine
Home Financials for this Owner
Home Financials are based on the most recent Mortgage that was taken out on this home.
Original Mortgage
$244,000
Interest Rate
3.66%
Purchase Details
Closed on
Jun 7, 2013
Sold by
Gardner Beverly J
Bought by
Demur Cynthia L and Miller Robin B
Purchase Details
Closed on
Jul 29, 1988
Sold by
Elzear Roy Const
Bought by
Briarwood Homes
Create a Home Valuation Report for This Property
The Home Valuation Report is an in-depth analysis detailing your home's value as well as a comparison with similar homes in the area
Home Values in the Area
Average Home Value in this Area
Purchase History
| Date | Buyer | Sale Price | Title Company |
|---|---|---|---|
| Demur David | -- | -- | |
| Demur David | $340,000 | -- | |
| Demur Cynthia L | -- | -- | |
| Gardner Beverly J | -- | -- | |
| Briarwood Homes | $99,666 | -- |
Source: Public Records
Mortgage History
| Date | Status | Borrower | Loan Amount |
|---|---|---|---|
| Open | Demur David | $285,180 | |
| Previous Owner | Demur David | $244,000 |
Source: Public Records
Tax History
| Year | Tax Paid | Tax Assessment Tax Assessment Total Assessment is a certain percentage of the fair market value that is determined by local assessors to be the total taxable value of land and additions on the property. | Land | Improvement |
|---|---|---|---|---|
| 2025 | $8,241 | $352,030 | $80,290 | $271,740 |
| 2024 | $7,966 | $352,030 | $80,290 | $271,740 |
| 2023 | $6,759 | $236,250 | $80,290 | $155,960 |
| 2022 | $6,759 | $236,250 | $80,290 | $155,960 |
| 2021 | $6,766 | $236,250 | $80,290 | $155,960 |
| 2020 | $6,766 | $236,250 | $80,290 | $155,960 |
| 2019 | $6,785 | $236,250 | $80,290 | $155,960 |
| 2018 | $6,937 | $236,600 | $73,640 | $162,960 |
| 2017 | $6,835 | $236,600 | $73,640 | $162,960 |
| 2016 | $6,672 | $236,600 | $73,640 | $162,960 |
| 2015 | $6,573 | $236,600 | $73,640 | $162,960 |
| 2014 | -- | $236,600 | $73,640 | $162,960 |
Source: Public Records
Map
Nearby Homes
- 278 Thompsonville Rd
- 120 2nd St
- 98 1st St
- 0 Suffield St Unit 24093452
- 0 Suffield St Unit 24057050
- 1 E Elaine Dr
- 45 Douglas St
- Lot 54 North St
- 424 Bridge St
- 713 Thrall Ave
- 4 Pebblestone Cir
- 24 Pebblestone Cir Unit 24
- 155 Mountain Laurel Way
- 83 Landing Cir Unit 83
- 78 Landing Cir Unit 78
- 779 Bridge St
- 18 Daniel Cir Unit 18
- 420 Halladay Ave W
- 80 S River St
- 15 Downing Way
Your Personal Tour Guide
Ask me questions while you tour the home.