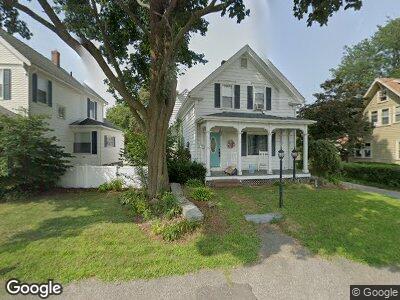
15 Wyman St Woburn, MA 01801
Downtown Woburn NeighborhoodEstimated Value: $688,359 - $780,000
4
Beds
3
Baths
2,192
Sq Ft
$328/Sq Ft
Est. Value
About This Home
This home is located at 15 Wyman St, Woburn, MA 01801 and is currently estimated at $718,840, approximately $327 per square foot. 15 Wyman St is a home located in Middlesex County with nearby schools including Wyman Elementary School, John F. Kennedy Middle School, and Woburn High School.
Ownership History
Date
Name
Owned For
Owner Type
Purchase Details
Closed on
Dec 11, 2015
Sold by
Hogan Rt
Bought by
Stmartin Amanda and Stmartin Wayne
Current Estimated Value
Home Financials for this Owner
Home Financials are based on the most recent Mortgage that was taken out on this home.
Original Mortgage
$377,852
Outstanding Balance
$305,617
Interest Rate
3.77%
Mortgage Type
New Conventional
Estimated Equity
$416,434
Create a Home Valuation Report for This Property
The Home Valuation Report is an in-depth analysis detailing your home's value as well as a comparison with similar homes in the area
Home Values in the Area
Average Home Value in this Area
Purchase History
| Date | Buyer | Sale Price | Title Company |
|---|---|---|---|
| Stmartin Amanda | $369,900 | -- |
Source: Public Records
Mortgage History
| Date | Status | Borrower | Loan Amount |
|---|---|---|---|
| Open | Stmartin Amanda | $91,000 | |
| Open | Stmartin Amanda | $377,852 | |
| Closed | Stmartin Amanda | $377,852 |
Source: Public Records
Tax History Compared to Growth
Tax History
| Year | Tax Paid | Tax Assessment Tax Assessment Total Assessment is a certain percentage of the fair market value that is determined by local assessors to be the total taxable value of land and additions on the property. | Land | Improvement |
|---|---|---|---|---|
| 2025 | $5,250 | $614,800 | $329,900 | $284,900 |
| 2024 | $4,669 | $579,300 | $314,200 | $265,100 |
| 2023 | $4,688 | $538,800 | $285,700 | $253,100 |
| 2022 | $4,486 | $480,300 | $248,400 | $231,900 |
| 2021 | $4,124 | $442,000 | $236,600 | $205,400 |
| 2020 | $4,107 | $440,700 | $236,600 | $204,100 |
| 2019 | $6,051 | $424,300 | $225,300 | $199,000 |
| 2018 | $3,809 | $385,100 | $206,700 | $178,400 |
| 2017 | $5,979 | $363,300 | $196,900 | $166,400 |
| 2016 | $3,440 | $342,300 | $184,000 | $158,300 |
| 2015 | $3,304 | $324,900 | $171,900 | $153,000 |
| 2014 | $3,225 | $308,900 | $171,900 | $137,000 |
Source: Public Records
Map
Nearby Homes
- 5 Colony Rd
- 3 Archer Dr Unit 3
- 11 Beach St
- 61 Mishawum Rd
- 0 Fryeburg Rd
- 14 Chestnut St
- 555 Main St Unit 16
- 555 Main St Unit 1
- 36 Middle St
- 5 Flagg St
- 85 Winn St
- 7 Davis St
- 22 James St Unit 1
- 22 James St
- 22 James St Unit 2
- 20 Lowell St
- 28 Van Norden Rd
- 22 Rumford Park Ave
- 855 Main St Unit 205
- 37 Montvale Ave Unit 6