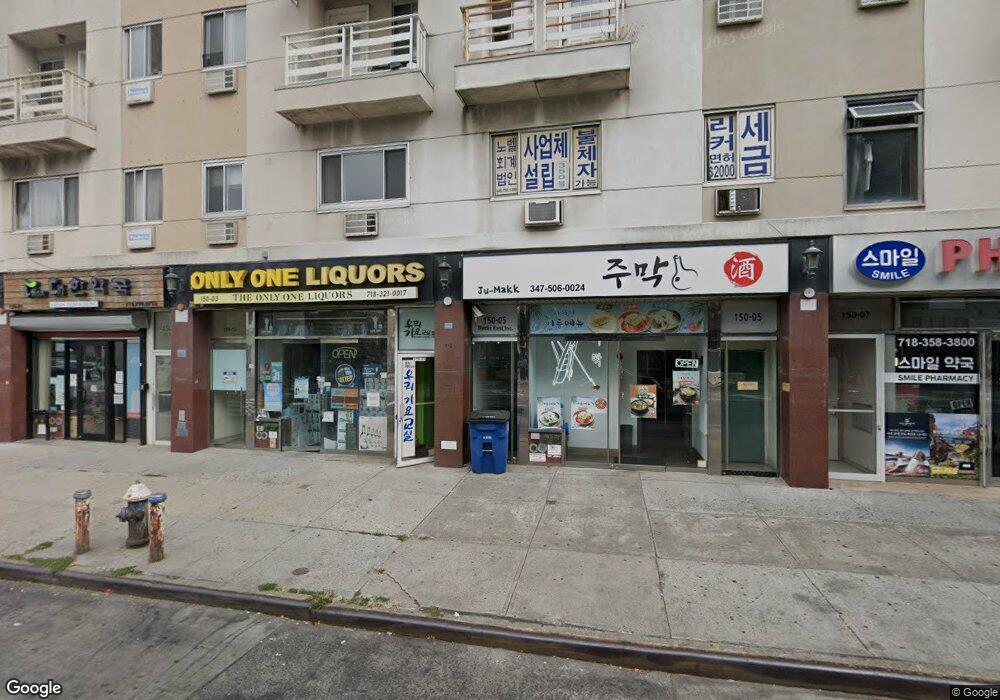
150-03 Northern Blvd Unit Base Flushing, NY 11354
Flushing NeighborhoodEstimated Value: $4,968,209
--
Bed
--
Bath
7,850
Sq Ft
$633/Sq Ft
Est. Value
About This Home
This home is located at 150-03 Northern Blvd Unit Base, Flushing, NY 11354 and is currently estimated at $4,968,209, approximately $632 per square foot. 150-03 Northern Blvd Unit Base is a home located in Queens County with nearby schools including P.S. 21 Edward Hart, Jhs 185 Edward Bleeker, and Flushing High School.
Ownership History
Date
Name
Owned For
Owner Type
Purchase Details
Closed on
Dec 17, 2020
Sold by
Ms2017 Llc
Bought by
Ms2017 Llc
Current Estimated Value
Purchase Details
Closed on
Jun 20, 2017
Sold by
Prosperous View Llc
Bought by
Ms2017 Llc
Home Financials for this Owner
Home Financials are based on the most recent Mortgage that was taken out on this home.
Original Mortgage
$700,000
Interest Rate
4.02%
Mortgage Type
Commercial
Purchase Details
Closed on
Oct 22, 2010
Sold by
Prosperous View Llc and Prosperous Way Llc
Bought by
Prosperous View Llc
Purchase Details
Closed on
Jun 27, 2007
Sold by
Northern 8883 Llc
Bought by
Prosperous View Llc and Prosperous Way Llc
Home Financials for this Owner
Home Financials are based on the most recent Mortgage that was taken out on this home.
Original Mortgage
$1,325,000
Interest Rate
6.48%
Mortgage Type
Commercial
Create a Home Valuation Report for This Property
The Home Valuation Report is an in-depth analysis detailing your home's value as well as a comparison with similar homes in the area
Home Values in the Area
Average Home Value in this Area
Purchase History
| Date | Buyer | Sale Price | Title Company |
|---|---|---|---|
| Ms2017 Llc | -- | -- | |
| Ms2017 Llc | $3,850,000 | -- | |
| Prosperous View Llc | -- | -- | |
| Prosperous View Llc | -- | -- | |
| Prosperous View Llc | $1,439,600 | -- | |
| Prosperous View Llc | $1,439,600 | -- |
Source: Public Records
Mortgage History
| Date | Status | Borrower | Loan Amount |
|---|---|---|---|
| Previous Owner | Ms2017 Llc | $700,000 | |
| Previous Owner | Prosperous View Llc | $1,325,000 |
Source: Public Records
Tax History Compared to Growth
Tax History
| Year | Tax Paid | Tax Assessment Tax Assessment Total Assessment is a certain percentage of the fair market value that is determined by local assessors to be the total taxable value of land and additions on the property. | Land | Improvement |
|---|---|---|---|---|
| 2025 | $83,554 | $668,327 | $28,050 | $640,277 |
| 2024 | $83,554 | $668,327 | $30,842 | $637,485 |
| 2023 | $80,964 | $647,612 | $35,863 | $611,749 |
| 2022 | $72,423 | $819,450 | $54,450 | $765,000 |
| 2021 | $59,360 | $963,900 | $54,450 | $909,450 |
| 2020 | $47,355 | $1,058,400 | $54,450 | $1,003,950 |
| 2019 | $39,749 | $921,240 | $54,450 | $866,790 |
| 2018 | $31,102 | $498,163 | $35,333 | $462,830 |
| 2017 | $21,602 | $461,263 | $34,818 | $426,445 |
| 2016 | $20,548 | $461,263 | $34,818 | $426,445 |
| 2015 | $9,219 | $395,460 | $38,128 | $357,332 |
| 2014 | $9,219 | $395,460 | $38,998 | $356,462 |
Source: Public Records
Map
Nearby Homes
- 35-10 150th St Unit 4
- 37-10 149th Place Unit 3A
- 14943 35th Ave Unit 5K
- 149-43 35 Ave Unit 3J
- 14906 Northern Blvd Unit 504
- 14906 Northern Blvd Unit 302
- 37-31 149th St Unit 2 M
- 34-25 150th Place Unit 2C
- 3425 150th Place Unit 6E
- 149-29 35th Ave
- 149-06 Northern Blvd Unit 304
- 38-15 149th St Unit 1A
- 38-15 149th St Unit 1S
- 38-15 149th St Unit 1G
- 38-15 149th St Unit 6H
- 14737 38th Ave Unit C48
- 14737 38th Ave Unit C23
- 3815 149th St Unit 2D
- 147-37 38th Ave Unit C66
- 14809 Northern Blvd Unit 5M
- 150-01 Northern Blvd Unit 4B
- 150-01 Northern Blvd Unit 4th Fl
- 150-01 Northern Blvd Unit 3rd fl
- 150-01 Northern Blvd
- 15001 Northern Blvd
- 150-05 Northern Blvd Unit 1FL
- 150-05 Northern Blvd Unit 4
- 15005 Northern Blvd
- 15003 Northern Blvd
- 35-25 150 St Unit Lower
- 35-25 150 St Unit 4A
- 35-25 150 St
- 150-07 Northern Blvd Unit 7
- 150-07 Northern Blvd
- 150-09 Northern Blvd
- 15009 Northern Blvd
- 150-11 Northern Blvd Unit 2 Fl
- 150-11 Northern Blvd Unit Cellar
- 15011 Northern Blvd
- 14950 Northern Blvd