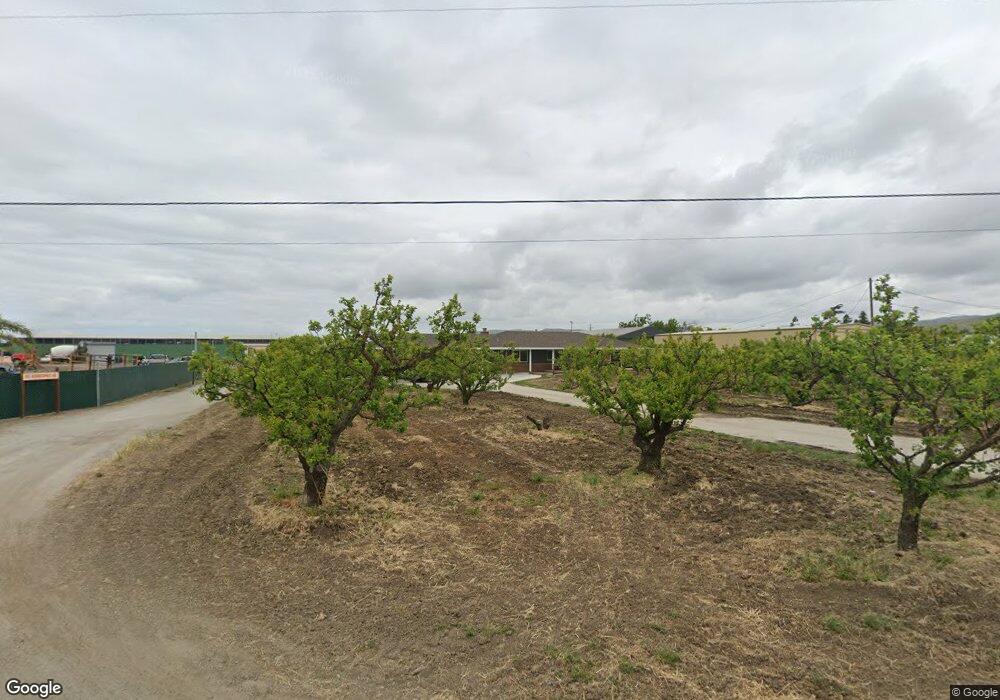
150 Acquistapace Rd Hollister, CA 95023
Estimated Value: $2,085,733
3
Beds
3
Baths
2,520
Sq Ft
$828/Sq Ft
Est. Value
About This Home
This home is located at 150 Acquistapace Rd, Hollister, CA 95023 and is currently estimated at $2,085,733, approximately $827 per square foot. 150 Acquistapace Rd is a home located in San Benito County with nearby schools including Spring Grove Elementary School, San Benito High School, and Hollister Seventh-day Adventist Christian School.
Ownership History
Date
Name
Owned For
Owner Type
Purchase Details
Closed on
Sep 14, 2022
Sold by
Hartman Gary R and Hartman Camille
Bought by
Gary R Hartman And Camille Hartman Ab Living and Hartman
Current Estimated Value
Purchase Details
Closed on
Jan 4, 2016
Sold by
Acquistapace Robert and Acquistapace Gene
Bought by
Hartman Gary R and Hartman Camille
Home Financials for this Owner
Home Financials are based on the most recent Mortgage that was taken out on this home.
Original Mortgage
$900,000
Interest Rate
3.92%
Mortgage Type
Purchase Money Mortgage
Purchase Details
Closed on
Dec 17, 2015
Sold by
Moore Robert H and Moore Alicia S
Bought by
Acquistapace Robert and Acquistapace Gene
Home Financials for this Owner
Home Financials are based on the most recent Mortgage that was taken out on this home.
Original Mortgage
$900,000
Interest Rate
3.92%
Mortgage Type
Purchase Money Mortgage
Create a Home Valuation Report for This Property
The Home Valuation Report is an in-depth analysis detailing your home's value as well as a comparison with similar homes in the area
Home Values in the Area
Average Home Value in this Area
Purchase History
| Date | Buyer | Sale Price | Title Company |
|---|---|---|---|
| Gary R Hartman And Camille Hartman Ab Living | -- | None Listed On Document | |
| Hartman Gary R | $1,200,000 | Chicago Title Company | |
| Acquistapace Robert | $1,200,000 | Chicago Title Company |
Source: Public Records
Mortgage History
| Date | Status | Borrower | Loan Amount |
|---|---|---|---|
| Previous Owner | Hartman Gary R | $900,000 | |
| Previous Owner | Acquistapace Robert | $200,000 |
Source: Public Records
Tax History Compared to Growth
Tax History
| Year | Tax Paid | Tax Assessment Tax Assessment Total Assessment is a certain percentage of the fair market value that is determined by local assessors to be the total taxable value of land and additions on the property. | Land | Improvement |
|---|---|---|---|---|
| 2025 | $18,052 | $1,525,381 | $621,491 | $903,890 |
| 2023 | $18,052 | $1,431,251 | $597,358 | $833,893 |
| 2022 | $17,471 | $1,402,780 | $585,646 | $817,134 |
| 2021 | $17,234 | $1,380,113 | $574,163 | $805,950 |
| 2020 | $17,179 | $1,371,277 | $568,276 | $803,001 |
| 2019 | $16,780 | $1,332,489 | $557,134 | $775,355 |
| 2018 | $16,071 | $1,298,695 | $546,210 | $752,485 |
| 2017 | $15,770 | $1,269,650 | $535,500 | $734,150 |
| 2016 | $4,961 | $422,998 | $66,021 | $356,977 |
| 2015 | $4,924 | $419,527 | $65,030 | $354,497 |
| 2014 | $4,736 | $411,793 | $63,757 | $348,036 |
Source: Public Records
Map
Nearby Homes
- 410 Anne Marie Ct
- 160 Tevis Trail
- 560 Tevis Trail
- 111 Ausaymas Ct
- 804 Comstock Rd
- 0 Bluff Dr
- 1152 Little River Dr
- 2101 Bert Dr
- 0 Bert Dr
- 1965 Airway Dr
- 1961 Airway Dr
- 1951 Airway Dr
- 790 Shore Rd
- 1353 Perry Ct
- 610 San Felipe Rd
- 773 San Felipe Rd
- 0 Lovers Ln Unit ML82021623
- 0 Edgewood Dr
- 0 Highway 25 Unit ML81983146
- 321 Summer Morning Dr
- 150 Aquistapace Rd
- 7600 Fairview Rd
- 7380 Fairview Rd
- 6970 Fairview Rd
- 154 Gina Ln
- 115 Comstock Rd
- 120 Gina Ln
- 158 Gina Ln
- 7701 Fairview Rd
- 530 Acquistapace Rd
- 150 Gina Ln
- 125 Comstock Rd
- 155 Comstock Rd
- 000 Los Viboras Rd
- 0 Los Viboras Rd
- 156 Gina Ln
- 135 Comstock Rd
- 165 Comstock Rd
- 8041 Fairview Rd
- 7870 Fairview Rd