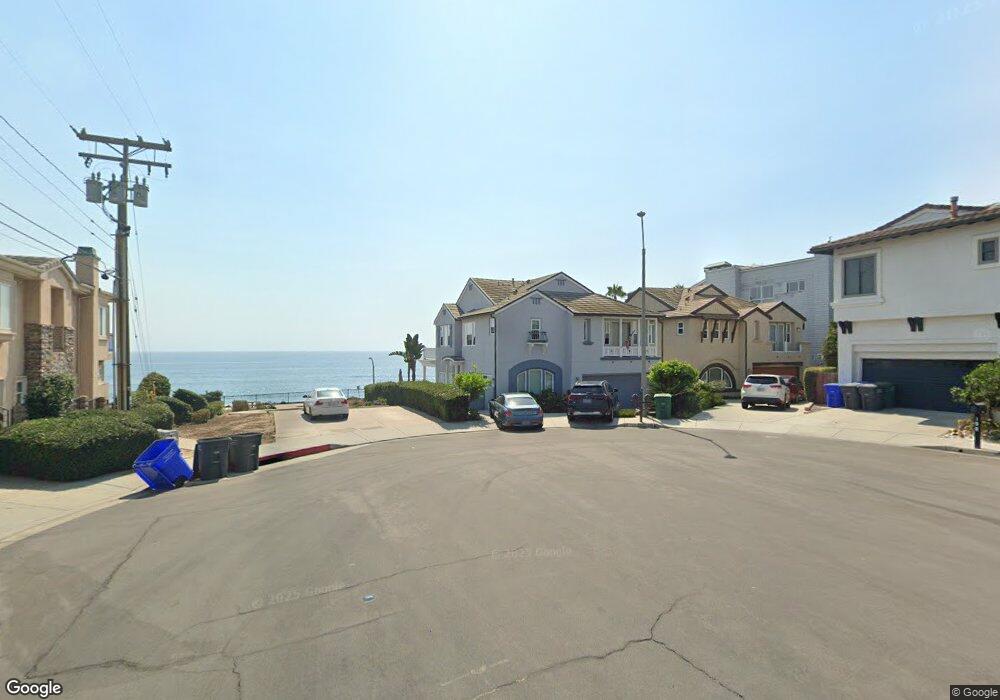
150 Chinquapin Ave Carlsbad, CA 92008
North Beach NeighborhoodEstimated Value: $2,843,680 - $4,565,000
4
Beds
4
Baths
2,928
Sq Ft
$1,328/Sq Ft
Est. Value
About This Home
This home is located at 150 Chinquapin Ave, Carlsbad, CA 92008 and is currently estimated at $3,888,920, approximately $1,328 per square foot. 150 Chinquapin Ave is a home located in San Diego County with nearby schools including Carlsbad High School, Sage Creek High, and St. Patrick Catholic School.
Ownership History
Date
Name
Owned For
Owner Type
Purchase Details
Closed on
Sep 10, 2010
Sold by
Guinn Dema L
Bought by
Isaacs John D and Isaacs Shirley A
Current Estimated Value
Purchase Details
Closed on
Feb 26, 2008
Sold by
Pacific Land Concepts Inc
Bought by
Guinn Kenny C and Guinn Dema L
Home Financials for this Owner
Home Financials are based on the most recent Mortgage that was taken out on this home.
Original Mortgage
$1,745,000
Interest Rate
4.62%
Mortgage Type
Unknown
Purchase Details
Closed on
Apr 14, 2003
Sold by
Duro Trav P
Bought by
Pacific Land Concepts Inc
Home Financials for this Owner
Home Financials are based on the most recent Mortgage that was taken out on this home.
Original Mortgage
$1,900,000
Interest Rate
5.72%
Mortgage Type
Construction
Purchase Details
Closed on
May 12, 1995
Sold by
Kennedy Larry D and Kennedy Lorna J
Bought by
Misetic Ante
Create a Home Valuation Report for This Property
The Home Valuation Report is an in-depth analysis detailing your home's value as well as a comparison with similar homes in the area
Home Values in the Area
Average Home Value in this Area
Purchase History
| Date | Buyer | Sale Price | Title Company |
|---|---|---|---|
| Isaacs John D | $1,850,000 | Fidelity National Title San | |
| Guinn Kenny C | $2,185,000 | Chicago Title Company | |
| Pacific Land Concepts Inc | -- | Chicago Title Co | |
| Misetic Ante | -- | South Coast Title Company |
Source: Public Records
Mortgage History
| Date | Status | Borrower | Loan Amount |
|---|---|---|---|
| Previous Owner | Guinn Kenny C | $1,745,000 | |
| Previous Owner | Pacific Land Concepts Inc | $1,900,000 |
Source: Public Records
Tax History Compared to Growth
Tax History
| Year | Tax Paid | Tax Assessment Tax Assessment Total Assessment is a certain percentage of the fair market value that is determined by local assessors to be the total taxable value of land and additions on the property. | Land | Improvement |
|---|---|---|---|---|
| 2025 | $24,778 | $2,370,166 | $1,601,466 | $768,700 |
| 2024 | $24,778 | $2,323,693 | $1,570,065 | $753,628 |
| 2023 | $24,655 | $2,278,131 | $1,539,280 | $738,851 |
| 2022 | $24,275 | $2,233,463 | $1,509,099 | $724,364 |
| 2021 | $24,092 | $2,189,670 | $1,479,509 | $710,161 |
| 2020 | $23,930 | $2,167,219 | $1,464,339 | $702,880 |
| 2019 | $23,496 | $2,124,726 | $1,435,627 | $689,099 |
| 2018 | $22,500 | $2,083,066 | $1,407,478 | $675,588 |
| 2017 | $22,127 | $2,042,223 | $1,379,881 | $662,342 |
| 2016 | $21,238 | $2,002,180 | $1,352,825 | $649,355 |
| 2015 | $21,153 | $1,972,107 | $1,332,505 | $639,602 |
| 2014 | $20,797 | $1,933,478 | $1,306,404 | $627,074 |
Source: Public Records
Map
Nearby Homes
- 111 Sequoia Ave Unit C
- 152-54 Redwood Ave
- 251 Redwood Ave
- 310 Chinquapin Ave
- 295 Chinquapin Ave
- 324 Chinquapin Ave
- 160 Hemlock Ave
- 370 Tamarack Ave
- 334 Date Ave
- 393 Date Ave
- 368 Hemlock Ave
- 141 Cherry Ave
- 187 Cherry Ave
- Cherry Beach Homes Plan at Cherry Beach Homes - Cherry Beach homes
- 164 Cherry Ave
- 3584 Garfield St
- 4007 Canario St Unit D
- 4007 Canario St Unit E
- 3578 Garfield St
- 4009 Canario St Unit H
- 152 Chinquapin Ave
- 156 Chinquapin Ave
- 121 Chinquapin Ave
- 111 Sequoia Ave
- 111 Sequoia Ave
- 111 Sequoia Ave Unit H
- 111 Sequoia Ave Unit G
- 111 Sequoia Ave Unit D
- 111 Sequoia Ave Unit E
- 111 Sequoia Ave Unit F
- 111 Sequoia Ave Unit A
- 111 Sequoia Ave Unit B
- 125 Chinquapin Ave
- 164 Chinquapin Ave
- 135 Chinquapin Ave
- 143 Sequoia Ave
- 129 Chinquapin Ave
- 145 Chinquapin Ave
- 151 Sequoia Ave
- 176 Chinquapin Ave