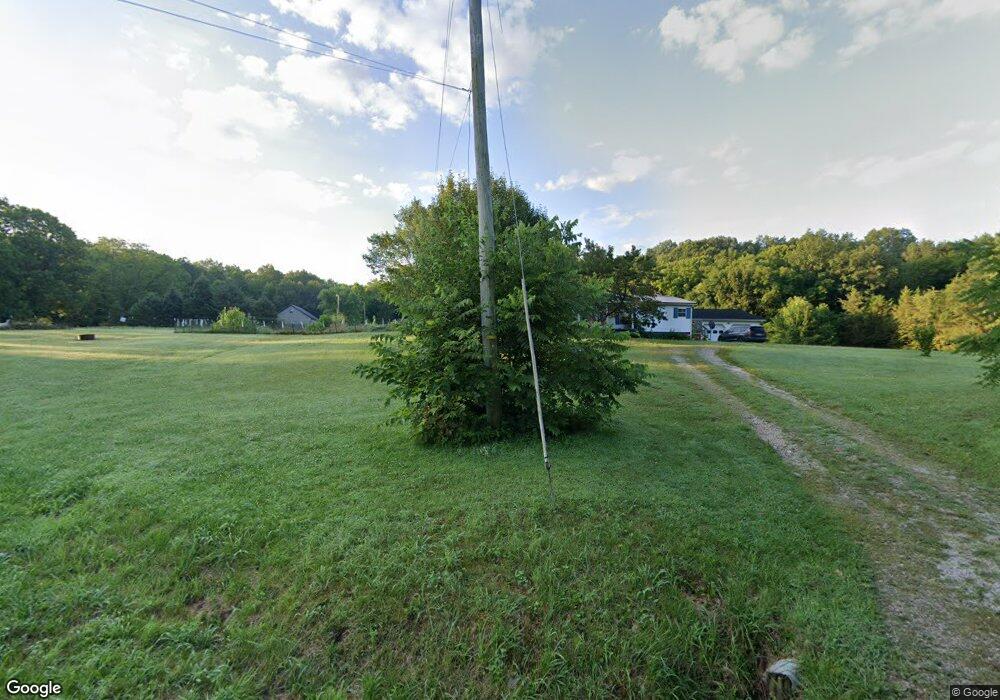
150 Clay Moore Rd West Union, OH 45693
Estimated Value: $128,000 - $226,000
3
Beds
2
Baths
1,456
Sq Ft
$108/Sq Ft
Est. Value
About This Home
This home is located at 150 Clay Moore Rd, West Union, OH 45693 and is currently estimated at $157,234, approximately $107 per square foot. 150 Clay Moore Rd is a home located in Adams County with nearby schools including North Adams Elementary School and North Adams High School.
Ownership History
Date
Name
Owned For
Owner Type
Purchase Details
Closed on
Oct 3, 2018
Sold by
Lacy John R
Bought by
Griffin Kyle M
Current Estimated Value
Home Financials for this Owner
Home Financials are based on the most recent Mortgage that was taken out on this home.
Original Mortgage
$16,875
Interest Rate
4.5%
Mortgage Type
Closed End Mortgage
Purchase Details
Closed on
Sep 20, 2017
Sold by
Bosso Ethel M
Bought by
Griffin Kyle M
Home Financials for this Owner
Home Financials are based on the most recent Mortgage that was taken out on this home.
Original Mortgage
$74,800
Interest Rate
3.9%
Mortgage Type
New Conventional
Purchase Details
Closed on
Oct 2, 2003
Sold by
Tansey Brian R
Bought by
Gray Jack A
Purchase Details
Closed on
Mar 25, 2002
Sold by
Nixon Andrew J
Bought by
Tansey Brian R
Purchase Details
Closed on
Apr 6, 1999
Sold by
Troyer Larry J
Bought by
Nixon Andrew J
Purchase Details
Closed on
Apr 13, 1998
Sold by
Taylor Rudolph
Bought by
Troyer Larry J
Purchase Details
Closed on
Aug 18, 1997
Bought by
Looney Rick L
Create a Home Valuation Report for This Property
The Home Valuation Report is an in-depth analysis detailing your home's value as well as a comparison with similar homes in the area
Home Values in the Area
Average Home Value in this Area
Purchase History
| Date | Buyer | Sale Price | Title Company |
|---|---|---|---|
| Griffin Kyle M | $22,500 | None Available | |
| Griffin Kyle M | $75,000 | None Available | |
| Gray Jack A | $105,000 | -- | |
| Tansey Brian R | $85,000 | -- | |
| Nixon Andrew J | $77,500 | -- | |
| Troyer Larry J | $65,000 | -- | |
| Looney Rick L | -- | -- |
Source: Public Records
Mortgage History
| Date | Status | Borrower | Loan Amount |
|---|---|---|---|
| Closed | Griffin Kyle M | $16,875 | |
| Previous Owner | Griffin Kyle M | $74,800 |
Source: Public Records
Tax History Compared to Growth
Tax History
| Year | Tax Paid | Tax Assessment Tax Assessment Total Assessment is a certain percentage of the fair market value that is determined by local assessors to be the total taxable value of land and additions on the property. | Land | Improvement |
|---|---|---|---|---|
| 2024 | $719 | $38,190 | $8,510 | $29,680 |
| 2023 | $1,438 | $38,190 | $8,510 | $29,680 |
| 2022 | $1,438 | $32,410 | $5,880 | $26,530 |
| 2021 | $1,325 | $32,410 | $5,880 | $26,530 |
| 2020 | $1,353 | $32,410 | $5,880 | $26,530 |
| 2019 | $1,288 | $32,410 | $5,880 | $26,530 |
| 2018 | $1,095 | $28,000 | $5,880 | $22,120 |
| 2017 | $718 | $28,000 | $5,880 | $22,120 |
| 2016 | $716 | $28,000 | $5,880 | $22,120 |
| 2015 | $715 | $28,600 | $5,950 | $22,650 |
| 2014 | $715 | $28,600 | $5,950 | $22,650 |
Source: Public Records
Map
Nearby Homes
- 4603 Wheat Ridge Rd
- 4016 Unity Rd
- 3551 Unity Rd
- 13529 Ohio 247
- 831 Tom Brown Rd
- 210 Walt Alsgood Rd
- 2157 Tater Ridge Rd
- 125 Robinette Rd
- 0 Tranquility Pike
- 363 Crystal Rd
- ac Ohio 247
- 1.15 ac Ohio 247
- 17479 Ohio 247
- 113 Columbia St
- 19004 State Route 41
- 6514 Tri County Rd
- 0 Lawshe Rd Unit 1854673
- 3460 Logans Ln
- 86 Hawk Hill Rd
- 1143 Dotson Rd
- 162 Clay Moore Rd
- 155 Clay Moore Rd
- 14 Clay Moore Rd
- 29 Clay Moore Rd
- 4647 Wheat Ridge Rd
- 4666 Wheat Ridge Rd
- 252 Clay Moore Rd
- 291 Clay Moore Rd
- 4479 Wheat Ridge Rd
- 4500 Wheat Ridge Rd
- 4848 Wheat Ridge Rd
- 206 Clay Moore Rd
- 4893 Wheat Ridge Rd
- 4399 Unity Rd
- 4271 Unity Rd
- 4313 Unity Rd
- 4291 Unity Rd
- 4361 Unity Rd
- 4153 Unity Rd
- 4312 Unity Rd